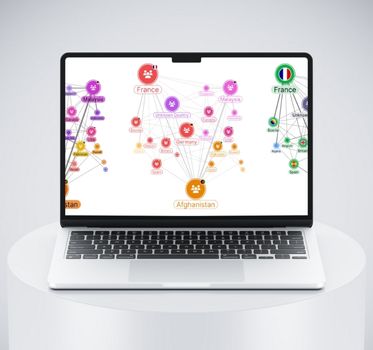
Are your visualizations overwhelming? Are your users submerged in chart clutter?
This webinar is for you.
When it comes to visualizing large graph datasets, a powerful rendering engine alone isn’t enough. You also need the tools to find insight in chart clutter. This webinar is about those tools.
Author and graph visualization expert, Corey L. Lanum, will share some of the ways you can eliminate clutter in your graph visualizations. He’ll explain each of the tools available, and how they can be combined into an effective and intuitive user experience.
This session includes a preview of the forthcoming v4.0 of KeyLines, our graph visualization SDK, which features a new approach to grouping and navigating graphs.
We hope to see you there!