FREE: Buyer's guide to graph visualization
This practical guide to choosing the right technology for your project includes a handy comparison template.
The decision to include graph visualization technology in your web application is a big one. Some know from the start that it’s essential to their project. Others are new to graph data and want to understand it better through visualization, or they have a legacy visual app with a UI that needs updating with the latest interactive technology.
However you reach the decision, knowing you need graph visualization is only the first step. How do you choose the right technology?
There are so many graph visualization options out there – from homegrown components built from open source graph libraries, and commercial software development kits, to off-the-shelf apps and diagramming tools. It can be tricky to decide which one is right for you. And once you’ve settled on an option, you need to choose the right partner to work with.
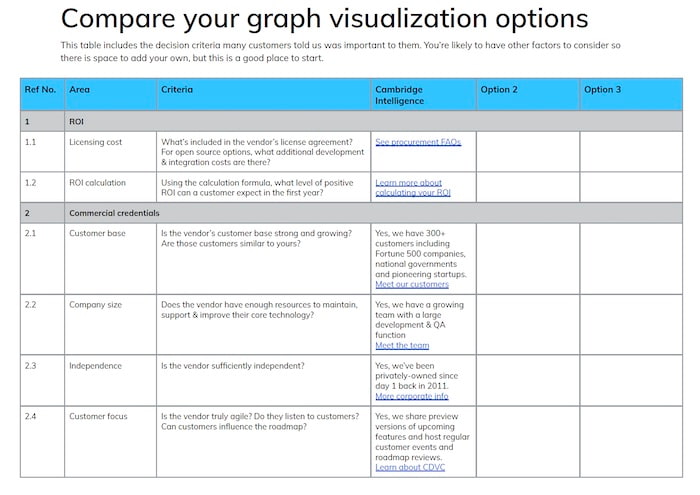
Our impartial buyer’s guide to graph visualization helps you make those decisions. It also includes a handy comparison template so you can weigh up your options more carefully.
The guide takes a deep dive into the 6 different decision criteria that customers told us were their top priorities:
We believe our graph data visualization toolkits deserve a place on every organization’s shortlist, but this guide isn’t a hard sell. Your project deserves the best partner, tool and technology. Cambridge Intelligence might not be a good fit for your needs at this time, but the guide should help you to consider your options thoroughly.
The comparison template is a handy checklist to see how well the other graph technologies on your shortlist measure up. You’re likely to find criteria already included in your organizations’ request for proposal (RFP) or request for quote (RFQ) documentation, but the template also encourages prospective customers to consider additional factors for a more comprehensive assessment.
Every stakeholder in a project like yours has a vested interest in who you partner with, and which technology you choose. We’re used to working with everyone from C-level executives to UX designers, to make sure everybodys’ questions are answered. This guide is essential for:
Starting on your graph visualization journey is an exciting time. We want to make sure you make the right decision for your organization, your use case, your data, and your users.
Let us help you take your first step towards success: download the buyer’s guide to graph visualization today.
This practical guide to choosing the right technology for your project includes a handy comparison template.
Registered in England and Wales with Company Number 07625370 | VAT Number 113 1740 61
6-8 Hills Road, Cambridge, CB2 1JP. All material © Cambridge Intelligence .
Privacy Policy | Security Framework


