Welcome to Connected Insights!
Connected Insights is a series of conversations and training sessions to help you maximize your investment in graph technology.
They’re a great chance to see what we’re working on, influence our product roadmaps and learn something new about connected data visualization.
We’ll run sessions throughout 2024 and beyond, open to all Cambridge Intelligence customers.

Shape the future of connected data visualization
We lift the lid on upcoming releases, new features and the latest research by our innovation teams.
You also get the chance to test-drive functionality before it’s released, and give feedback on our product roadmaps.

Exclusive to Cambridge Intelligence customers
These sessions are two-way conversations. We want to hear about your challenges, successes and data visualization experiences.
Take the opportunity to chat with other attendees, make your opinions known through polls or unmute yourself and join the live conversation.

Expert-led sessions and training
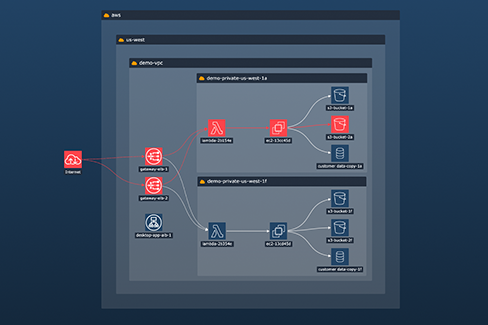
Each session is led by one of our data visualization experts, and has a specific focus – from geospatial analysis to visualizing cyber security data.
Most are suitable for any technical ability, while developer training sessions are aimed at coders.
Upcoming sessions
Signing up is simple, and you can register for as many sessions as you like.
Is there a burning topic you want us to cover? Let us know!
Wednesday 13 November 2024
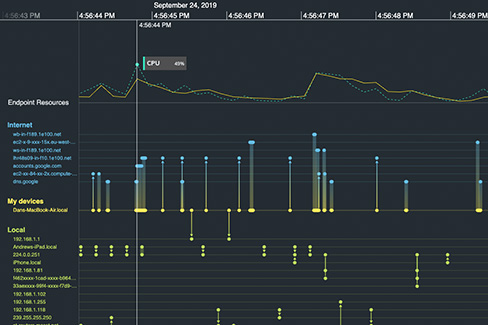
New approaches to building powerful timelines
We’re working on new ways to visualize time data, and want to share our progress with you.
Connected data investigations often involve a time element, from decades-long criminal cases to digital forensic reports unpicking events with millisecond resolution.
Building graph visualizations that show a time dimension is a difficult challenge, and there are countless approaches you might choose.
In this session, we’ll showcase some revolutionary new ways to represent time across all our products, and ask you for feedback.
Along the way, we’ll cover specific topics including:
- Synchronizing graph behavior with time data visualizations
- Enriching your graph visualizations with KronoGraph
- Managing time-based investigations at scale
- Combining intuitive high-level views that help the user dig into the low-level detail.
- Communicating key messages and adding your own insights
This is a future technologies event and a knowledge-sharing session. We’ll look at current challenges, and share best practice advice and previews of cutting-edge prototypes we want to get your thoughts on.
We’ll run this session twice, for different timezones:
Ideal for EMEA & APAC
- Wednesday 13 November 2024
- 10am GMT · 11am CET · 12pm IST
- Duration: 1 hour
Ideal for the Americas
- Wednesday 13 November 2024
- 8am PST · 10am CST · 11am EST
- Duration: 1 hour
Wednesday 05 February 2025
Design workshop: How to create great UX for complex data
Calling all product and UI/UX designers! Join our first ever design workshop for best-practice tips, inspiration, and a sneak peek at our upcoming data visualization design tools for Figma.
Designers have never been more influential in data-centric product development. With good reason, too: design can make the difference between a great data visualization experience and a frustrating one.
And when you’re working with highly customizable SDKs like KeyLines, ReGraph or KronoGraph, it’s not always obvious where to start.
In this session, our expert UI and UX designers will lead you through topics like:
- The basics of graph and timeline visualization that all design teams should know
- What design templates and resources are available to get you prototyping UIs quickly for KeyLines, ReGraph and KronoGraph
- The design challenges that come with visualizing networks, and how good UX can help users make sense of complexity.
You’ll also get inspiration from guest speakers and our team of expert
We’ll run this session twice, for different timezones:
Ideal for EMEA & APAC
- 05 February 2025
- 10am GMT · 11am CET · 12pm IST
- Duration: 1 hour
Ideal for the Americas
- 05 February 2025
- 8am PST · 10am CST · 11am EST
- Duration: 1 hour
Frequently asked questions
The Connected Insights series is all about helping our customers do more with connected data visualization. They’re free, concise and expert-led sessions addressing specific topics, so it’s a great opportunity to learn something new.
But it’s also your chance to give direct feedback to us – on our products, roadmaps or any other issues you want to discuss.
Anyone who designs, builds and deploys connected data visualization applications. Product Managers, UX/UI designers, front-end developers and commercial leads are all welcome.
Some technical sessions are better suited to developers. See the ‘who should attend this session?’ information on the individual event listings for details.
Sorry, no. The Connected Insights series is exclusive to Cambridge Intelligence customers only.
If you’re not a customer but would like to be involved, get in touch with our team. We might be able to schedule a separate session with you.
We’ll use our online events platform, Livestorm. You can join the meetings from any browser – there’s no need to download anything. Learn more about Livestorm’s technical requirements
To encourage free-flowing conversation, we don’t plan to share Connected Insights session recordings. Instead, we’d encourage you to join the live meetings and get the full experience!
If that isn’t possible, we’re happy to run a specific session for you and your team. Get in touch if you’d like to arrange a one-on-one briefing.
Yes! Following a hiatus, face-to-face Connected Insights meetings are back. We’ll kick-off with Connected Insights Cambridge in October 2024, but keep an eye out for future events near you.
If you think we should visit your city, let us know.