 Maintaining the integrity of cyberinfrastructure and understanding network vulnerabilities is a critical task for organizations and governments.
What about the biggest network of them all – the internet? It is increasingly evident that some of the core foundations of the internet contain major vulnerabilities open to abuse. Most notably the Border Gateway Protocol (BGP).
In this blog post we’ll visualize BGP data to understand BGP’s flaws, and what role graph visualization could play in fixing them.
What is the Border Gateway Protocol?
Very simply, the Border Gateway Protocol (BGP) decides how data gets from one place to another online.
The internet is formed of tens of thousands of interacting Autonomous Systems (AS) – groups of IP Networks defining the locations of different network assets. BGP is a routing mechanism that determines how the request you type into a web browser finds its way to the correct IP address, inside the correct AS, via the shortest possible path.
For this to happen, ASes send packets to each other containing the IPs they hold. When a BGP router receives one of these packets, it propagates the information onward, adding itself to an AS chain. This allows routers to determine how many ‘hops’ would be required to reach a certain IP.
Why is BGP insecure?
Despite being a core protocol for the modern web, BGP is old and insecure – based largely on trust. If a router starts broadcasting errant messages to the rest of the network, huge volumes of traffic can be misdirected. A notable example of this comes from the recent hacking of Hacking Team.
Among the 400gb of company data dumped online were email messages suggesting that the Italian Raggruppamento Operativo Speciale (Special Operations Group – or ROS) had worked with Hacking Team and the Aruba ISP, to hijack 256 IP addresses it did not own.
Read about how Hacking Team helped ROS with their BGP routing hijack
This is possible because BGP favors specificity, and because any router can announce any prefix once its original owner stops announcing. If an AS correctly broadcasts ownership of 1024 addresses, but then a different AS falsely claims ownership to 256 of those addresses, other ISPs will believe that route to be the most direct. In under a minute, this false information can be propagated to the internet’s backbone of central routers.
BGP hijacking can potentially be catastrophic: networks can be overloaded, sensitive data can be intercepted or tampered with, and machines can be infected with malware.
Visuaizing BGP: using graphs to detect BGP hijacks
Let’s try visualizing BGP data as a graph. BGP data is fairly tricky to get hold of, but one old example is particularly well documented – when Pakistan Telecom (PT) managed to take YouTube offline.
Back in February 2008, Pakistan’s telecommunications ministry issued a censorship order, telling PT to block its users from accessing YouTube.com.
Instead (and it’s unclear whether this was an accident) PT set its network of routers to broadcast ownership of YouTube’s IP prefixes. Hong Kong-based PCCW Global failed to block the incorrect announcement, instead forwarding it to the rest of the world.
Within 45 seconds, all YouTube traffic had been re-directed and YouTube was offline.
Let’s take a closer look at the events of Sunday 24 February 2008:
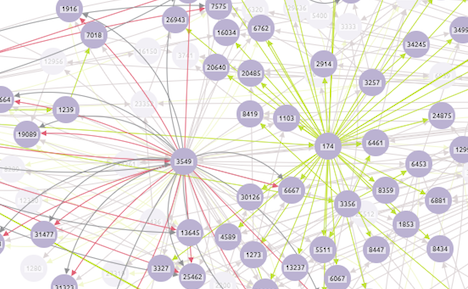
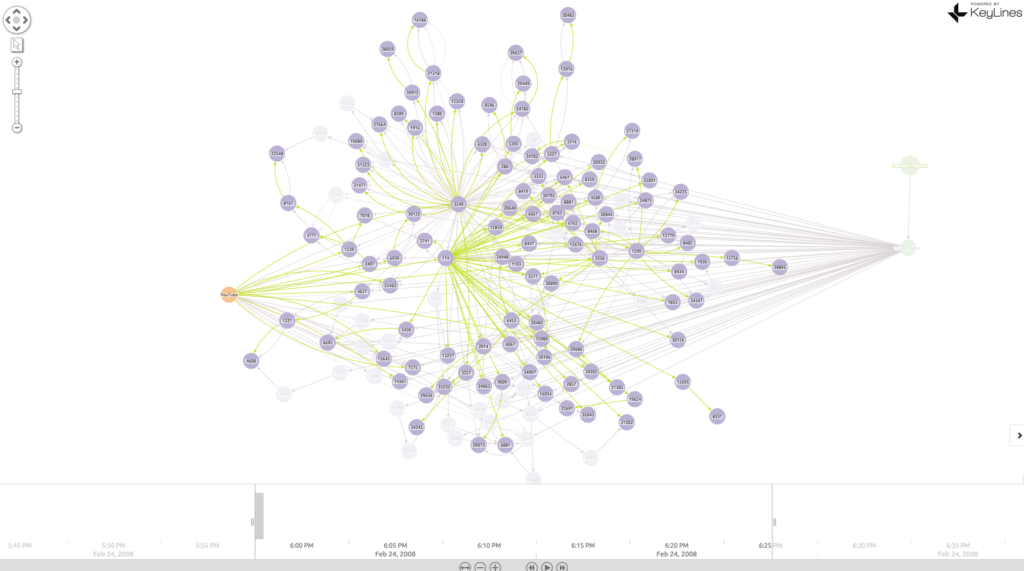
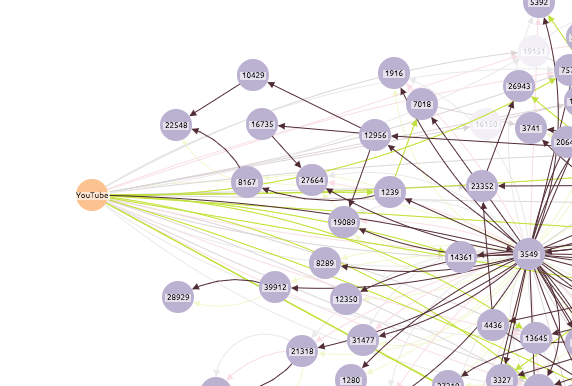
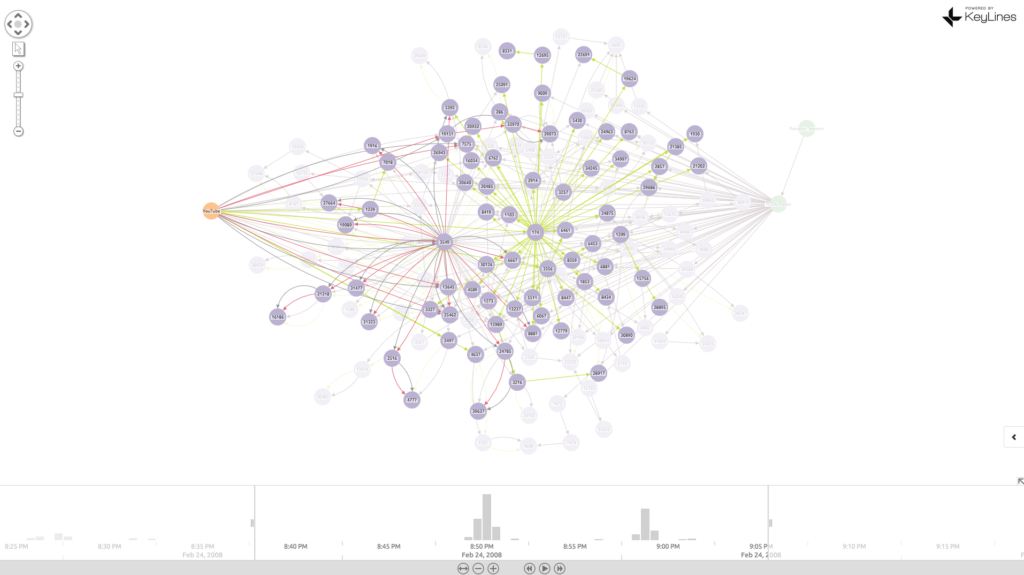
BGP visualization 1: 18:00 – YouTube (AS36561 – orange node) is happily broadcasting ownership of it’s range of 1024 IP addresses (208.65.152.0/22). This is being propagated (green links) around a network of ISPs (purple nodes):
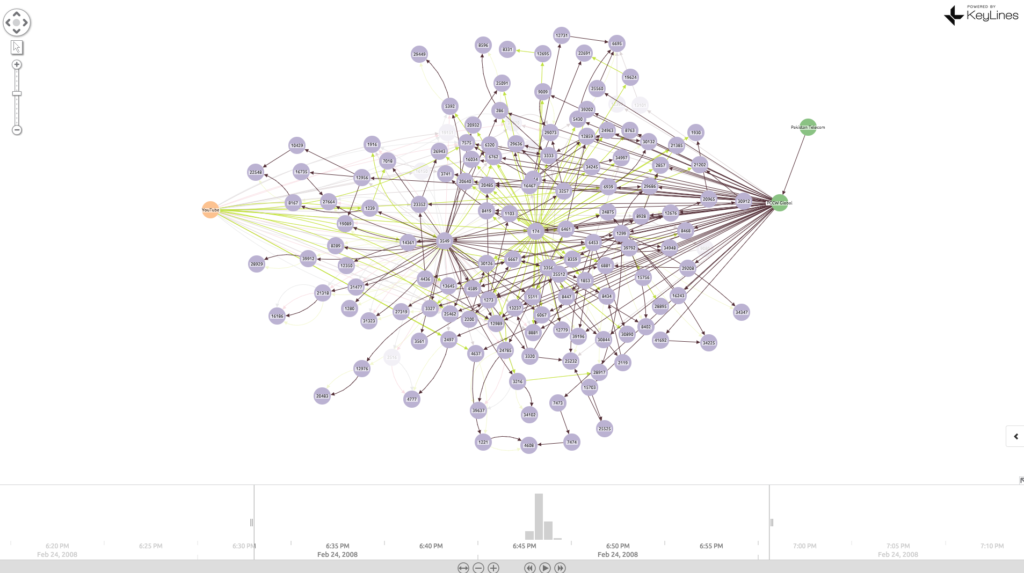
18:45 – Pakistan Telecom starts to broadcast ownership of 208.65.153.0/24 (black links) – 256 addresses, a subset of YouTube’s IP addresses. This is a more specific destination, which BGP prefers.
18:47 – 18:49 – Via PCCW, routers around the world receive the false announcement. YouTube traffic is directed to Pakistan:
20:07 – AS36561 (YouTube) starts a countermeasure and itself announces 208.65.153.0/24 – the 256 IPs previously claimed by Pakistan Telecom (shown as a single black link emanating from YouTube):
20:18 – AS36561 (YouTube) starts another countermeasure and announces 208.65.153.128/25 and 208.6.5.153.0/25 – two more specific ranges of 128 IPs (they simply split the prefix space in two):
21:01 – PCCW Global withdraws the prefixes from AS17557 (PT) – successfully stopping the hijack.
Why visualize BGP data as a graph?
Cyber security data poses unique challenges. It is often automatically generated at millisecond levels of resolution and filled with complex and evolving connections. The best way for a human to make sense of it is through visualization.
Learn more about visualizing cyber threat intelligence
Do you have complex cyber security data or threat intelligence you need help to understand. Get in touch to see how our graph visualization toolkits can help, or jump right in with a free trial: Try our graph visualization toolkits.
Share: