We’re excited to release KeyLines 6.0 – the latest major version of our graph visualization toolkit for JavaScript developers.
It’s the culmination of months of work, including hundreds of improvements throughout the SDK to help you deliver the perfect user experience.
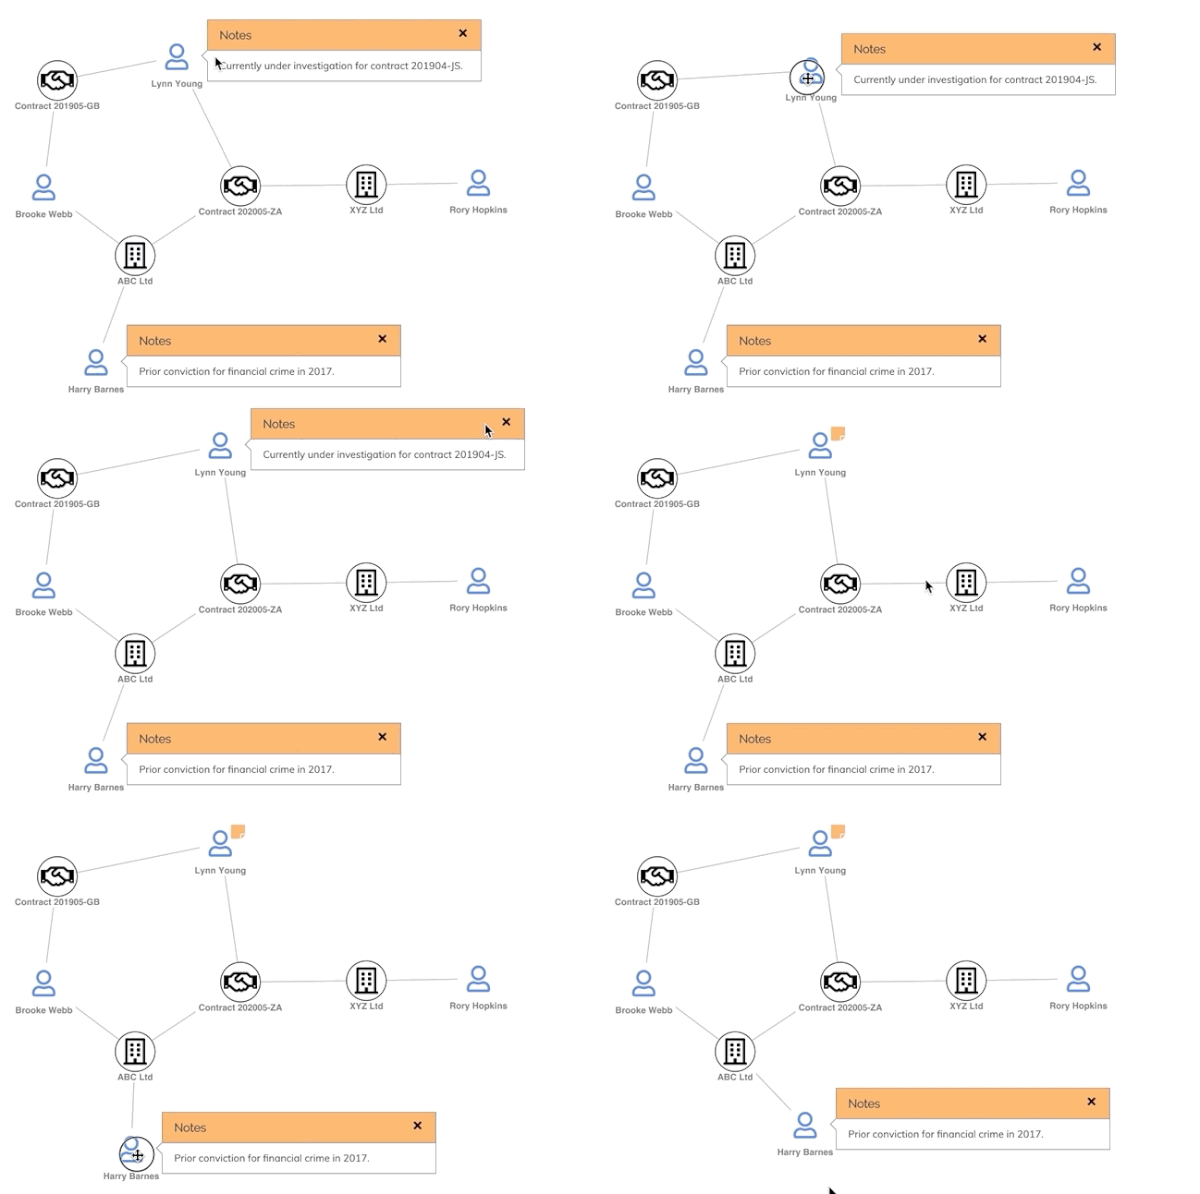
Harness the power of events
KeyLines’ event model has always been one of the toolkit’s most powerful and underrated features.
It’s the mechanism developers use to define what happens when a user interacts with a KeyLines chart. If double-clicking on a node should expand its connections, you simply attach the ‘expand’ function to the ‘double-click’ event. By layering up these combinations, you define a user experience that responds intuitively to every click, drag, hover, or other interaction using the keyboard, mouse, or touch. It’s a big part of what makes KeyLines so flexible and easy to build with.
KeyLines 6.0 features a completely overhauled event engine, designed to follow all the latest best practices. The new event engine gives you:
- absolute control over user interactions
- more consistent behavior across devices
- enhanced support for touch devices, track-pads, and keyboard interactions


We recommend you start working with the new and better events API right away, but we’ll continue to support the old one for a while too.
Adaptive layouts to keep you on track
It’s a frustrating visualization experience: you’ve taken time to understand a graph – inspecting specific nodes and links to build a picture in your mind of what’s happening.
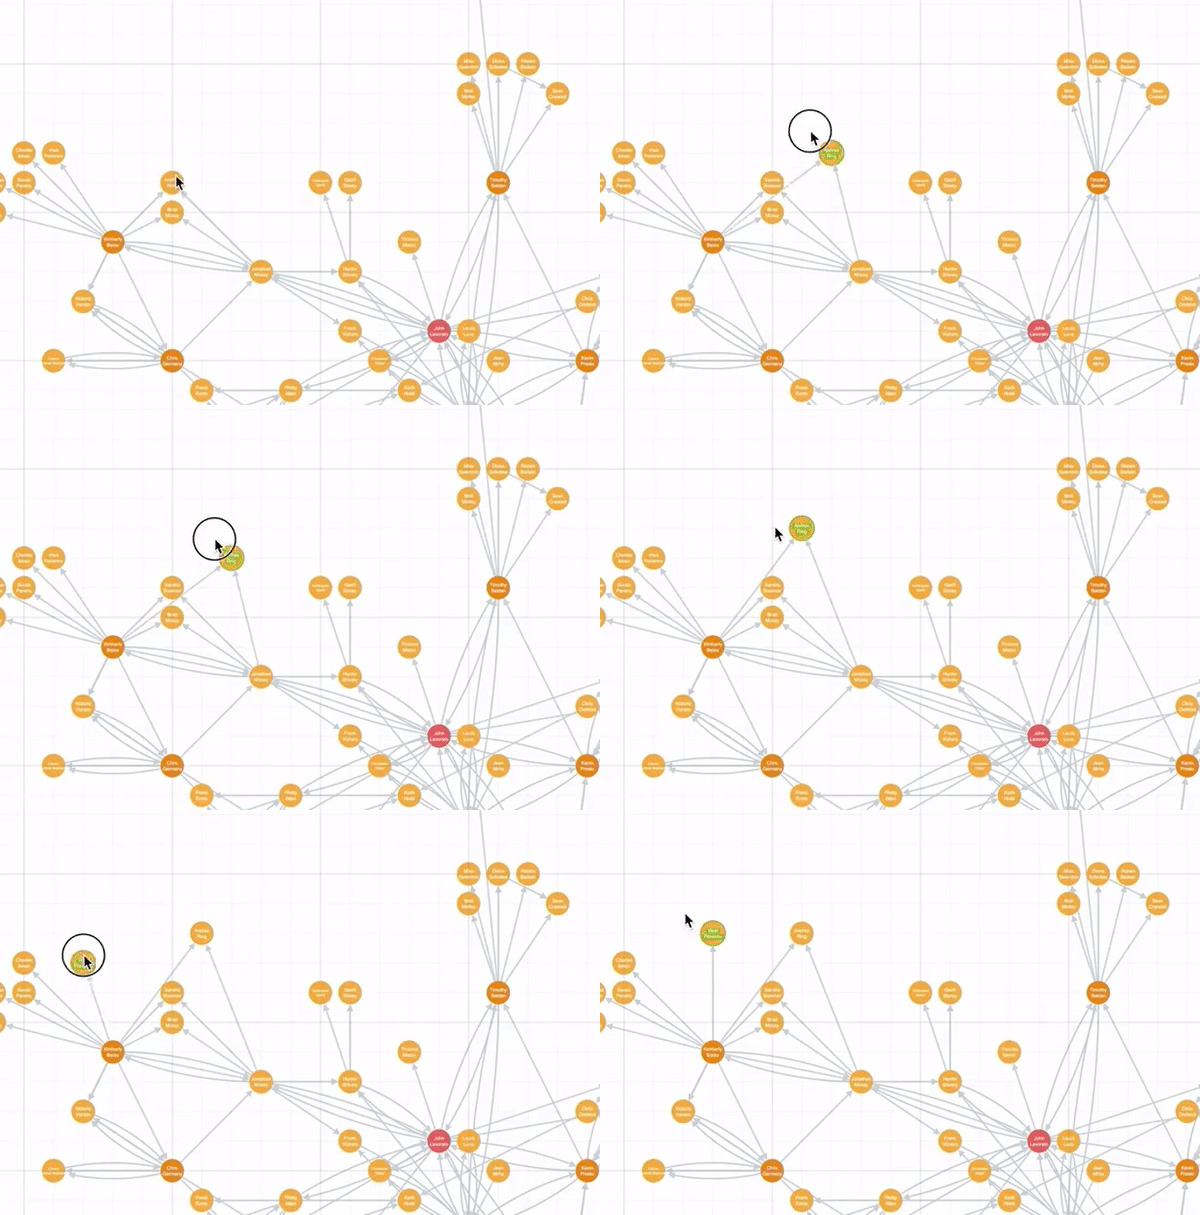
Then you expand a node and the entire graph changes. Nothing is where it was a second ago and you lose your train of thought. But you don’t want new nodes and links just dropped on top of your graph, either.
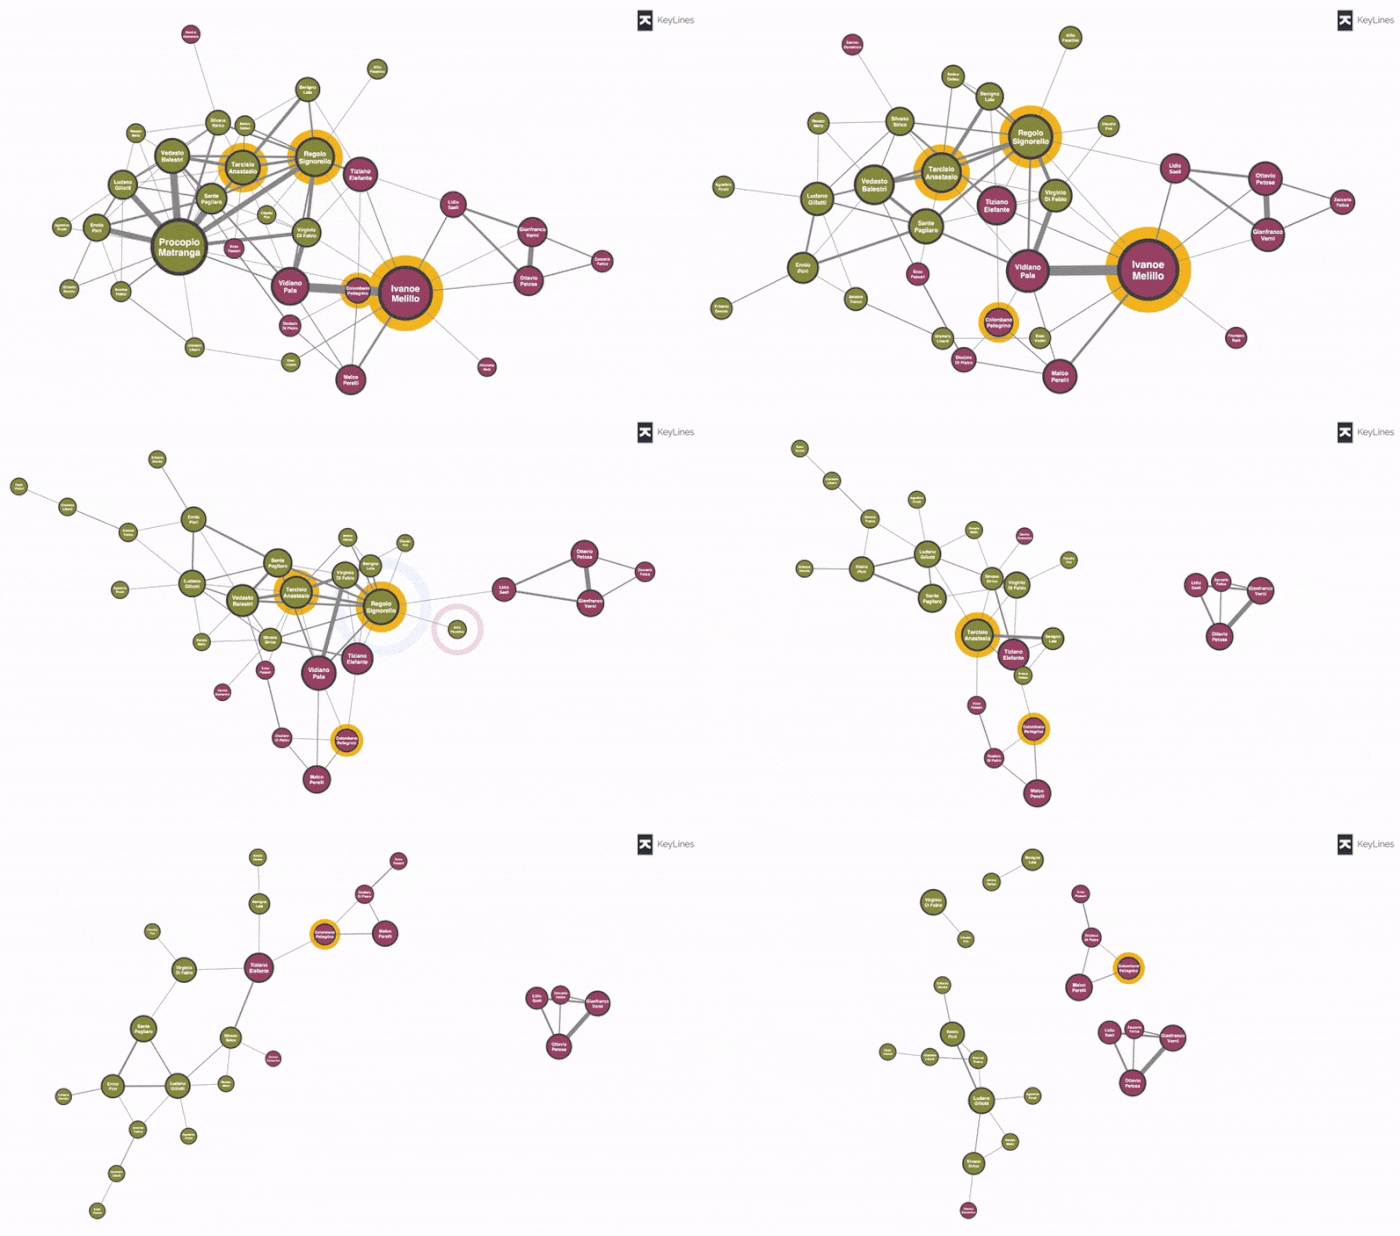
Adaptive layouts are the answer. They’re ‘just right’: a happy medium between a full layout and no layout. New items are added to existing white space, with other network components gently pushed outward.
KeyLines 6.0 comes with a new demo, showcasing the use of adaptive layouts as you explore a network of Sicilian mafia families.

To see adaptive layouts in action, try our new mafia demo.
Make waves with curved links
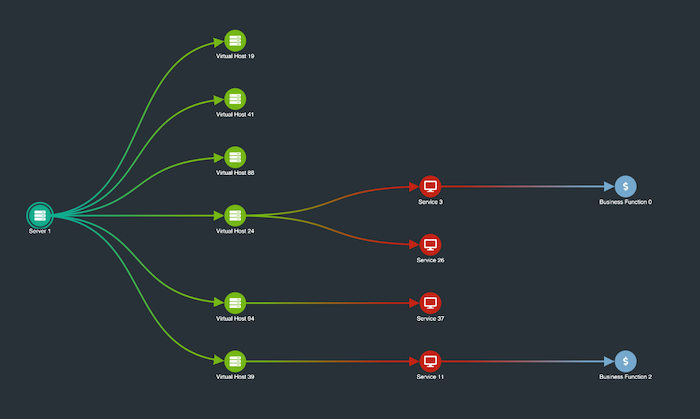
Another new feature of KeyLines 6.0 is the ability to add slick curved links to your graph visualizations. These new links add character to your visualizations and look great, especially when paired with the sequential layout:

As well as breathing new life into your charts, they also add clarity to data with lots of connections between different levels. You can see them in action throughout the SDK, including the hierarchies, impact analysis and styling charts demos.
New demos
When you next visit the KeyLines SDK site, you’ll find a number of new demos to explore added functionality. Take a look at the release notes for details. You’ll find the latest minor enhancements there too.
Ready to get started?
You’ll find more information, including release notes, on the KeyLines SDK. If you don’t already have access, request a trial account here.


