Focus on the detail
Filtering is a powerful way to reduce noise and reveal insight in your graphs.
You can apply filters to any property of your data, revealing the nodes and links you need to understand. It’s easy to transition from a global view of a vast data landscape to a focused exploration of key items.
Understand the big picture
Filters make it easy to experiment with different views of the dataset.
Users can explore charts at a global level to see how groups of nodes affect the overall dynamic. By showing and hiding clusters, you can view the interactions between sub-networks to discover dependencies and connections that aren’t immediately visible.
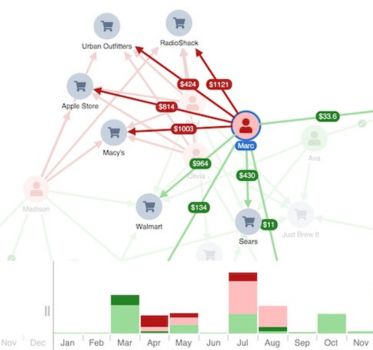
Combine with other measures
Combining filters with other graph analysis measures and algorithms increases their potential effectiveness.
Here, for example, filtering is combined with the degree social network analysis measure gradually revealing tightly-bound clusters in the graph.
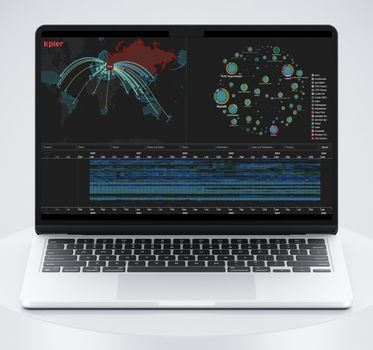
Understand time-based trends
Filtering by time reveals trends and patterns that are invisible when data is viewed all at once.
Our time bar shows how connected data evolves over time.
Seamless integration with the chart means filtering can be chart driven (select chart items so the time bar shows when they happened) or time bar-driven (select a point in time or duration so the chart shows which items were involved).
Ready to learn more?
Filtering is a powerful graph visualization tool.
Start an evaluation of our products to try it on your own data.