The next generation of visual timeline analytics is now available, with the release of KronoGraph 2.0.
Our web-based timeline visualization tool now has the unique ability to combine thousands of timelines into a single view, so users can display their entire dataset at once. There’s also an innovative way to examine individual timelines without losing context, plus handy glyph support to make points of interest stand out.
Get a better overview of your time data
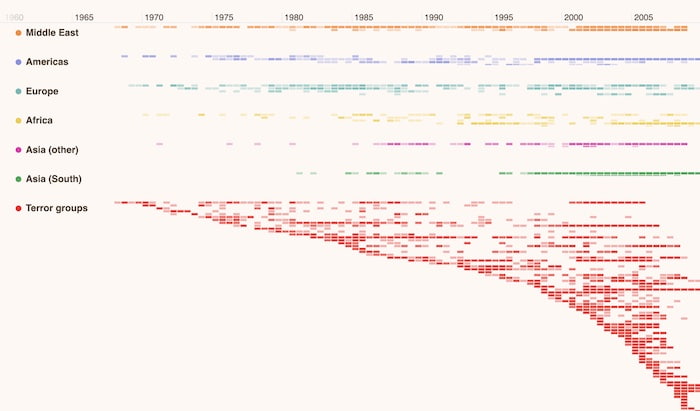
No matter how big your time-based dataset is, KronoGraph smartly adjusts the timeline to fit into your application UI.
In earlier versions, multiple entities collapsed automatically into closed groups or summary rows to make larger timelines easier to manage. It was an efficient way to group similar items and reduce clutter, but we’ve developed a new method. Seeing all the data at once gives a bird’s eye view, showing its overall shape. Surges or lulls stand out, revealing the entities and events to explore further.
Inspect individual timelines in context
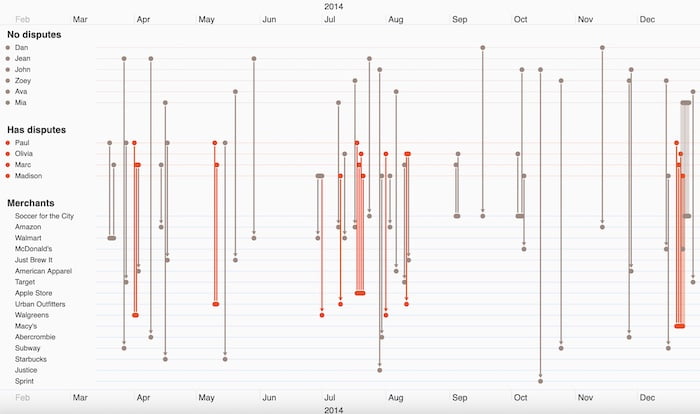
When investigators need to drill down into the detail to inspect a subset of the timeline more closely, they can now rely on an innovative new feature called the lens.
Click on areas of interest on the timeline to reveal a more detailed lens view. It acts as a magnifying glass over individual timelines without obscuring the rest of the dataset. Users see larger entities in the center of the lens with a natural tapering view of entities at the peripheries.
Intuitive interactions with the lens slider
Fluid interactions make the lens highly intuitive. Simply scrolling through the timeline shifts the area of focus. And the handy lens scrollbar shows the user exactly where they are in the overall dataset. They’ll never get lost in the data, no matter how many timelines they’re viewing at once.
Attention-grabbing glyphs
Graph visualization users know how effectively glyphs draw attention to items of interest in a network chart. Now timeline visualization users can use them too.
Color-coded glyphs as circles on entities or entity types are easy to identify. They’re a powerful way to highlight items deep in the timeline so investigators can earmark them for further analysis or flag key entities to colleagues. And the bigger the dataset, the more useful it is to surface contextual information such as alerts or statuses.
Take a tour of KronoGraph 2.0
Join Matt Latham, KronoGraph’s Product Manager, as he walks you through the highlights of this latest major release. You’ll see the lens view in action, get practical suggestions on using glyphs, together with tips and tricks to help you get the most out of KronoGraph 2.0.
Try the new major version for yourself
We offer free trials of all our toolkits, so it’s easy to see how the lens and the other great timeline analysis features work with your own data. You can even see how KronoGraph works with our graph visualization SDKs – KeyLines and ReGraph – to produce a powerful timeline and network analysis tool.
Simply sign up now to start your visualization project.
Share: