We’re excited to announce the release of version 1.0 of KronoGraph, our timeline visualization SDK.
Over 100 JavaScript and React developers in some of the world’s leading security and anti-fraud organizations took part in our hugely successful KronoGraph early access program. With the release of version 1.0, timeline visualization applications built using KronoGraph can now be shipped to customers.
No matter what kind of data you’re working with – cell phone records, financial transactions, IT network traffic – there’s always a time dimension. Investigators in a range of use cases need to understand precisely when events occurred so they can spot important patterns and key sequences. The challenge is finding a way to do this clearly and easily when there are masses of events to analyze.
KronoGraph offers an innovative and elegant solution. It’s a powerful toolkit for building timeline visualizations that uncover the hidden story in time-based data.
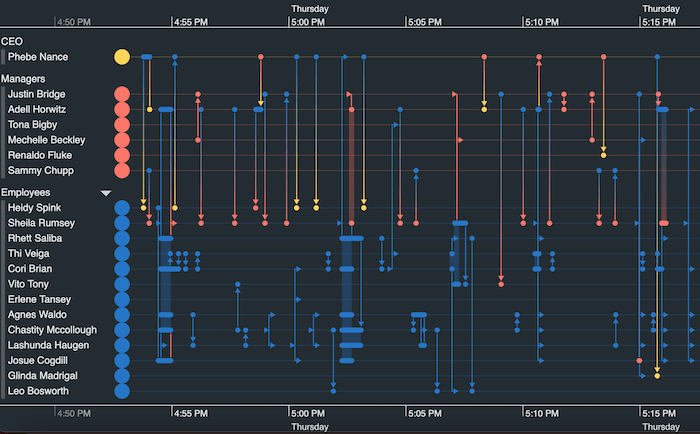
You can work with huge datasets from any time-based data source – KronoGraph’s rich timelines visualize every entity, event and connection to reveal insight fast. With its heatmap view and intelligent data aggregation, it scales beautifully whether you have ten events in your timeline visualization or 100,000. Analyze data spanning decades or drill down to explore individual milliseconds: every interaction is intuitive.
Using KronoGraph to create standalone timeline visualization applications gives investigators a unique way of understanding how complex sequences unfold. For an even more feature-rich investigative tool, KronoGraph integrates seamlessly with KeyLines, our JavaScript graph visualization SDK and ReGraph, our React graph visualization SDK. Exploring networks and timelines in complementary ways provides users with two powerful views of the same data.
KronoGraph supports a wide range of different operating systems and browsers, too.
During the early access program, developers experienced how easy it is to build customized timeline visualizations into existing applications, thanks to the SDK site’s quality documentation, detailed API library and useful Storybook examples.
Head of Product Management at Cambridge Intelligence, Dan Williams said:
“We’re grateful to everyone who joined the KronoGraph EAP and helped make it our most popular program yet. Releasing KronoGraph version 1.0 is a huge milestone – it means applications built with our latest toolkit can now be shipped to customers so they can start understanding their time-based data better. We’re excited about the future scope for timeline visualization and the impact it’ll have on the speed and effectiveness of investigations.”
You can sign up today for a free trial of KronoGraph. Alternatively, get in touch and we’ll demonstrate how our timeline visualization toolkit will revolutionize the way you analyze time-based data.
Share: