JavaScript data visualization tools for powerful user experiences
Real-world data is complicated. Visualizing it shouldn’t be.
Our developer toolkits make it easy to build powerful, customized user experiences for complex data.
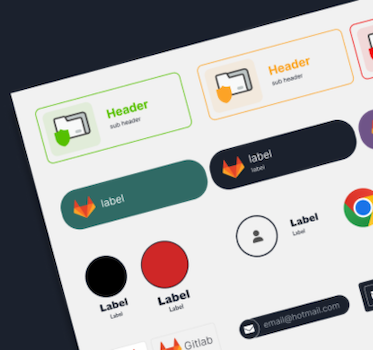
New: design smarter, prototype faster
Designing beautiful and intuitive graph and timeline visualizations just got easier.
The Cambridge Intelligence Figma Design Kit streamlines your workflow, from concept to code.
We’ve helped teams just like yours
Build your big ideas on the foundation of our data visualization expertise.
We’ve partnered with leading organizations in cybersecurity, intelligence and fraud detection for years. We understand your data visualization challenges, and how to overcome them.


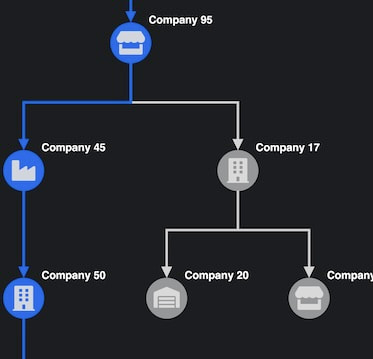
Complex data visualization. It’s in our DNA.
And it’s a must-have data analysis tool in a growing number of domains. Here are the top three use cases:
-

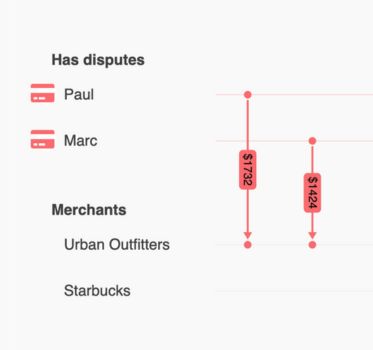
Fraud detection
Discover new ways to find insight, make sense of connections in your data and help combat fraud. -

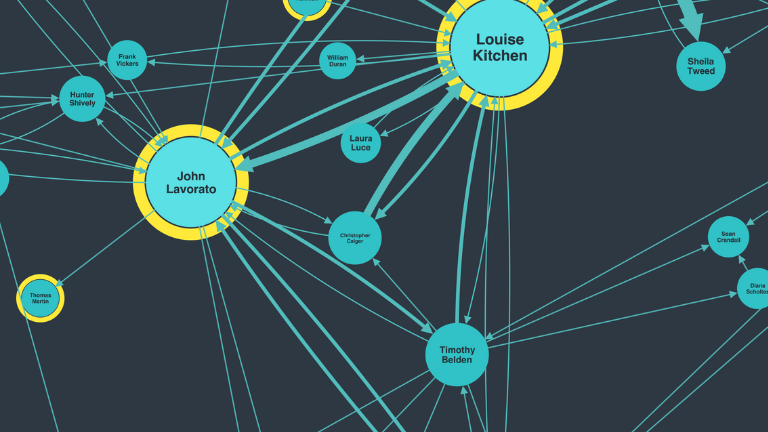
Security & Intelligence
Understand communications patterns, filter out noise and focus on key data to help prevent crime. -

Cyber security
Give analysts the tools to visualize and understand vast, complex, highly-connected cyber security data.
Why visualize data?
The world is complex. With powerful data visualization, you can make sense of it by uncovering insight that reveals threats, risks and opportunities.
-
It’s intuitive
Exploring data visually instantly makes sense, even to people who’ve never worked with complex timeline or connected data before.
-
It’s fast
Our brains are great at spotting patterns, but only when they’re presented in a tangible format. Our data visualizations help you identify trends and outliers quickly.
-
It’s scalable
Data visualization simplifies complexity, reveals context and uncovers detail. With one chart, you can see a high-level overview or dive into specific events, activities or connections.
-
It’s insightful
Through interactive data analysis, you gain deeper knowledge and understand context. That’s hard to achieve with a static, aggregated visualization.
Learn more
-

White papers
Our white paper reports cover data visualization best practice and real-world industry use cases. -

Customer stories
See how our toolkits solve real world challenges, from law enforcement to supply chain analysis. -

Video library
Including how-tos and data visualization examples from many different industries.