FREE: Start your KronoGraph trial today
Request full access to our KronoGraph SDK, demos and live-coding playground
We’ve just released KronoGraph 2.1, packed with new features to help analysts spot patterns, understand context and share insights with colleagues.
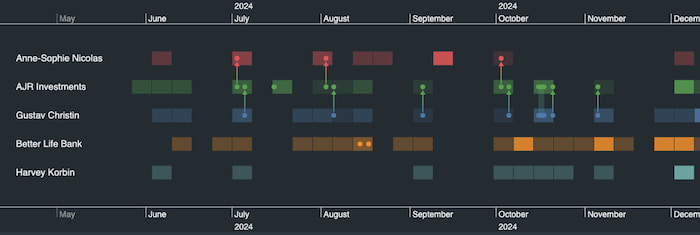
It builds on the enhancements made in KronoGraph 2.0 – our new generation of timeline visualization at scale – bringing new analytical features to the heatmap.
Let’s dive in.
Whatever time-based data you’re visualizing – financial transactions, phone data records, network monitoring logs – there’s a good chance you’re looking for a few key events in a sea of activity.
It may take some time for analysts to strike gold as they zoom in and out of potentially interesting parts of the heatmap. It’s even more time-consuming when they’re working with large datasets.
To make your analysts’ workflows more efficient, they can now reveal events without leaving the heatmap view – letting them see specific activity in the context of the wider dataset.

It’s a faster and more productive way to spot patterns in big data.
Sign up for a free KronoGraph trial to see this new feature in action. It’s in our Reveal story.
Tooltips are an intuitive way to add context to your timeline visualizations, without creating clutter.
They show information, like transaction amounts, event counts or endpoint addresses, on-demand, helping to tell the stories buried in data.
Our latest update lets you add handy tooltips to heatmap cells. This means users can see information related to whole clusters of events, making it easier to spot trends, activity spikes and recurring patterns.
Take a look at our Heatmap Tooltips story to see how it could enhance your application.
Dissemination is a vital part of any intelligence cycle. When shared with colleagues, annotated timelines make complex event sequences easy to understand and ensure everyone knows what’s going on.
You can now export PNG images of your KronoGraph timelines to share with colleagues, include in compliance reports, submit as evidence in court, or use in any other way you might need.
See our Export to PNG story for more details.
The easiest and quickest way to get started with KronoGraph is through a free trial. We can’t wait to hear from you. Request a trial