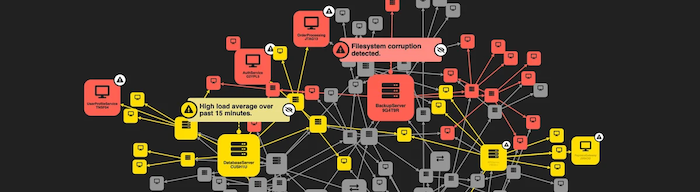
An intelligence analyst spots suspicious activity across a network. She needs to see the full topology to understand the context, but also drill into specific connection events to verify her hypothesis.
A support team manager reviews hundreds of overlapping tickets to find bottlenecks. He needs the timeline overview, but also individual ticket details.
A maritime operator monitors vessel movements across an entire region, but needs to know the instant a ship crosses into restricted waters.
The common thread here is that the best data visualizations adapt to how people actually work. Sometimes you need the 30,000-foot view to spot patterns. Other times, you need to zoom into individual events, nodes, or trajectories. The problem is that most tools force you to pick one or the other.
Our latest SDK updates tackle this tension head-on. Whether you’re visualizing network graphs, timelines, or geospatial data, you now have more control over how users move fluidly between overview and detail.
KronoGraph update: Timelines that expand on demand
Timeline visualizations typically aggregate overlapping events to keep things readable. But what happens when your user needs to see those individual events? KronoGraph’s new expandedRows feature offers an elegant solution. Duration events that overlap in time automatically expand across multiple sub-rows – either on demand or automatically. Your users can explore dense event clusters without losing the overall timeline context.
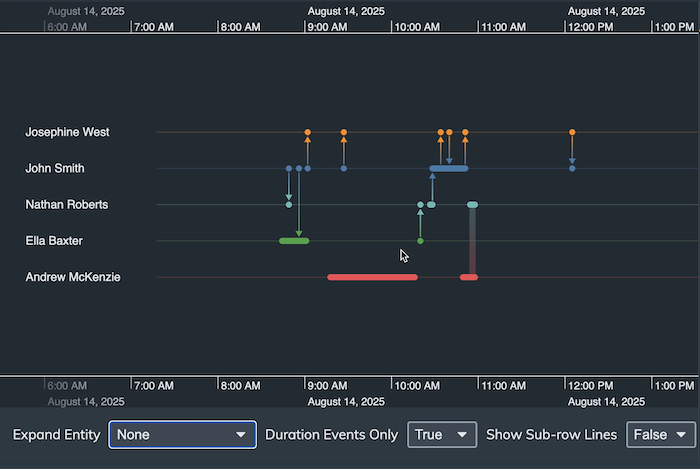
We built a Business Process Analysis demo that shows this in practice. It reveals performance patterns and bottlenecks in support team workflows by letting analysts drill into overlapping ticket events while keeping the big picture visible. No more toggling between views or losing your place.
MapWeave: Geospatial precision meets contextual awareness
MapWeave’s observations layer has always let you track entities as they move across maps. But knowing where something is becomes far more valuable when you can act on that position.
The latest release lets you access current tracker positions, and use them to trigger behaviors – like alerting users when a vessel crosses into protected waters, or when an aircraft enters restricted airspace.
Our new maritime scenario demo demonstrates this beautifully. As you scrub through time, the system detects when tracker nodes intersect with boundary shapes in real-time. It’s the foundation for building intelligent alerting and monitoring into your geospatial applications.
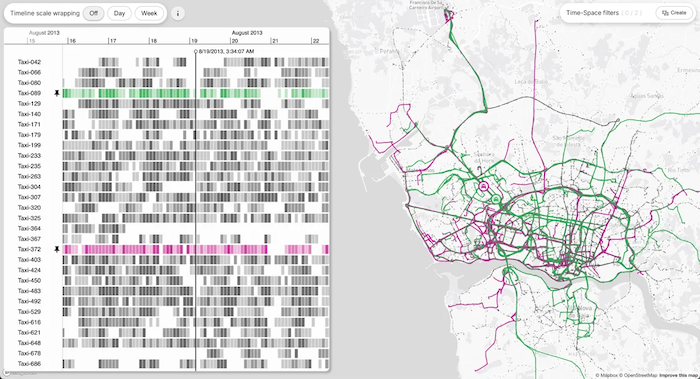
Want to see it with real data? Our Pattern-of-Life showcase uses an open-source dataset of 1.4 million taxi observations to demonstrate how the observations layer handles scale. The integrated KronoGraph timeline lets you filter, focus, and discover movement patterns – switching seamlessly between macro patterns and individual journeys.
Try them yourself
All updates are available now for customers and evaluators. Browse the SDK sites for full details and changelog, or request a trial to explore these features hands-on.
Want a guided walkthrough? Get in touch – we’d love to show you what’s new.


