FREE: Start your trial today
Visualize your data! Request full access to our SDKs, demos and live-coding playgrounds.
As creators of software development kits (SDKs) for connected data visualization, we understand the importance of a brilliant developer experience. Central to that is our interactive live coding environments.
We call them playgrounds, but they’re more than just a plaything.
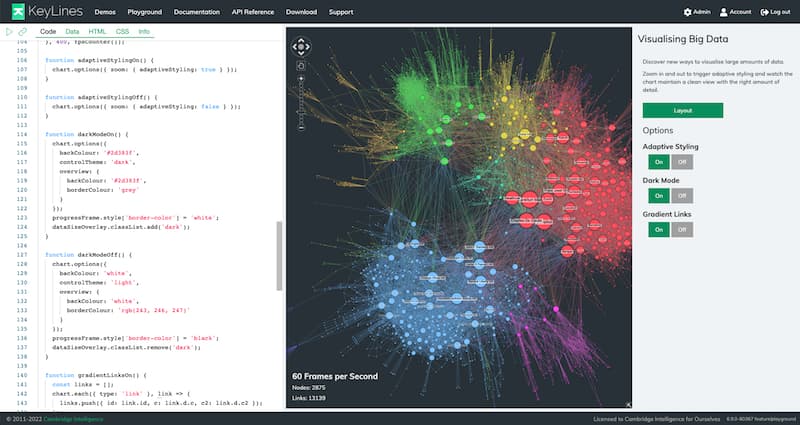
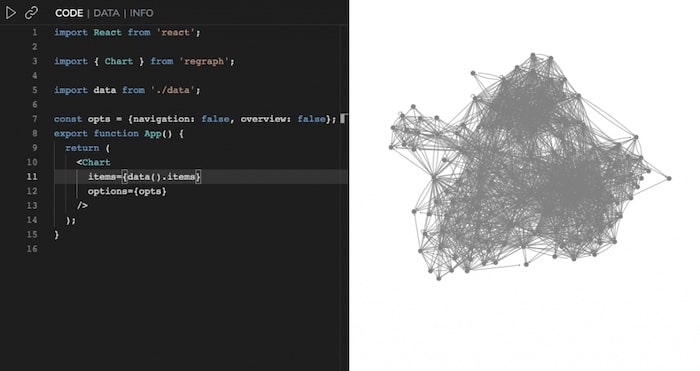
With the playgrounds, you can write or paste a KeyLines, ReGraph or KronoGraph application into your browser, make changes, and instantly visualize the result. It’s all done client-side: your code is executed locally in the browser, with syntax highlighting and code completion provided by the same Monaco editor that powers Microsoft Visual Studio Code.
Using an encoded URL means you can share code snippets easily and securely. We don’t save anything on our server. In fact, because the source is encoded into the URL hash, it isn’t even sent to the server.
Since we introduced playgrounds into our products, they’ve transformed the way we – and our users – share, debug and even test code.
Here are five reasons why our users love them.
Our toolkits make it quick and easy to build powerful, interactive graph and timeline visualizations, fully customized to match your users’ workflows and applications.
The playgrounds open up these experiences so you can change the appearance and behavior of charts or timelines on the fly.
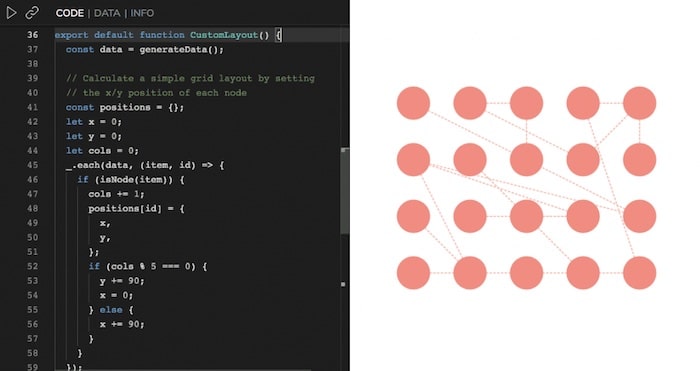
The great news is that you don’t have to be an expert-level coder to get the exact look and feel you want. Anyone can make a visualization of their own.
Our SDK sites are full of demos and code snippets. Wherever you see an edit button, you can load an example into a playground. From there, you can customize it to your heart’s content, playing with themes and styles, adding your own data, exploring different options and learning as you go. All without having to download an IDE.
Teams do their best work together, and the playgrounds are great collaborative tools.
Our own development team use them to test functionality, interactions and styling, and share their work. Just hit the share  button and send the link to a teammate.
Sharing links is secure and private because your code and data are encoded into the URL hash. When you paste the link, the browser doesn’t even send this part of the URL up to the server.
There’s no need to wait for a build deployment, no intermediate infrastructure to worry about, and no security concerns. It’s so quick to prototype and share playground code that for many users it’s become part of their day-to-day development cycle.

Visualize your data! Request full access to our SDKs, demos and live-coding playgrounds.
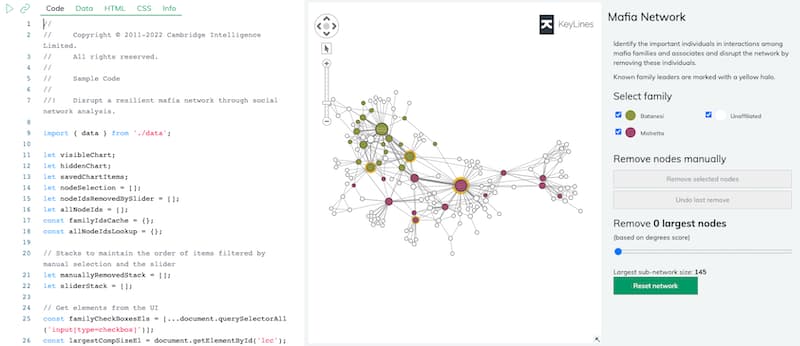
There are two fundamental parts to any data visualization: the app which the user interacts with, and the underlying data.
Our playgrounds give you an app right out of the box. All you have to do is add some data.
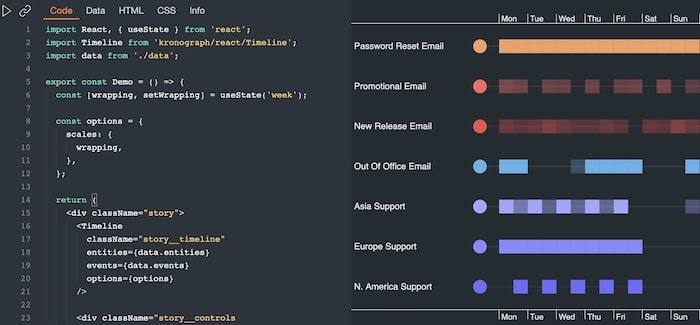
The playgrounds provide a dedicated data tab to capture your data. KeyLines and ReGraph use a simple JSON format that describes nodes and links, while KronoGraph relies on the same format to describe entities and events. You can see examples in each playground’s data tab. All you have to do is paste in your data and convert it into the right format with a few lines of JavaScript.
Remember, we don’t store your code or data anywhere: everything runs inside the browser and is completely secure.
Doing data visualization the right way is a challenge: apps can get complicated, data can be messy, and users may find it hard to deliver the insightful tools their analysts need.
Our development teams are on-hand to help you get the best out of your application. But it can be hard for users to explain exactly what is going wrong by sharing annotated screenshots or code fragments.
With the playgrounds, it’s easy for you to share exactly what the problem is so we can get you back on track fast.
Once you reproduce your issue in a playground and share the link with our team, we can understand precisely what’s going on. And in turn, we can send a working code solution back to you. Everyone’s a winner.
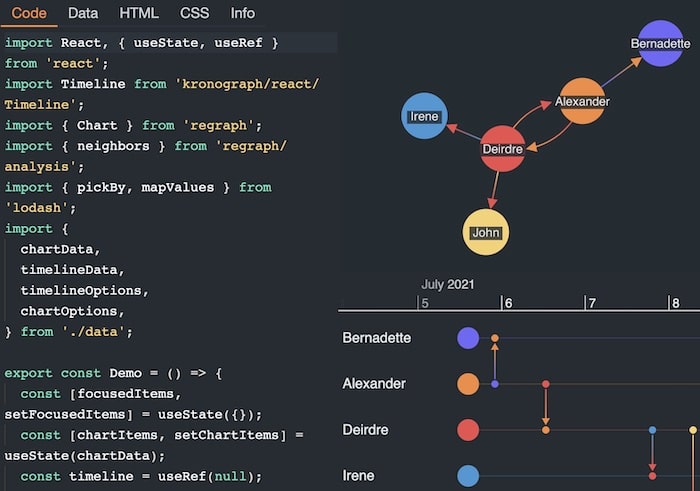
Users who want to get the most insight from their data create hybrid visualization applications using KronoGraph and ReGraph or KeyLines. Combining graph visualization with timeline analytics provides two powerful views of the same data. It’s the most effective way to reveal hidden threats and interesting patterns.
You can use the KronoGraph playground to build integrations with our graph visualization toolkits fast. This makes it so easy to try out different interaction patterns and understand how to synchronize content between graph and timeline views.
We love how the playgrounds have accelerated our own development cycle, but we’re even happier that they’re making life easier for users creating their own graph and timeline visualization applications.
Prototyping and sharing code has never been easier and more effective, and learning how our toolkits can bring your connected data to life has never been more fun!
Ready for some serious playtime with our toolkits? Request a free trial
This post was originally published some time ago. It’s still popular, so we’ve updated it with new information to keep it useful and relevant.


