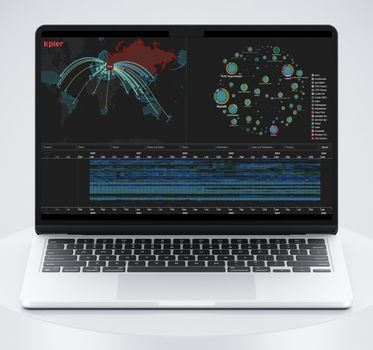
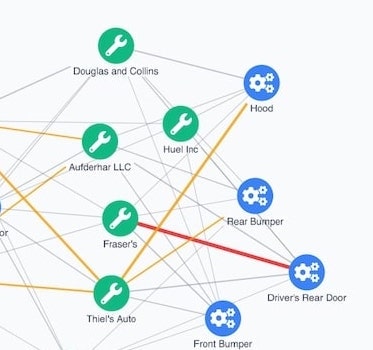
In this extract from our Connected Insights design workshop in February 2025, guest speaker Shahar Kagan shares his design considerations for data visualization.
He shows how good design can reveal the stories in complex connected data, and explores these ideas through the lens of six real examples of UI/UX designs for network maps.
About Shahar Kagan

Shahar Kagan is an expert in UX/UI design and product strategy, specializing in complex B2B platforms, cybersecurity solutions, and data-driven dashboards. With years of experience, he helps companies transform aggregated data into actionable insights through intuitive and functional design.
- Read Shahar’s article on how to build network maps for asset management and cybersecurity products
- Visit his website shaharkagan.com
- Follow Shahar on LinkedIn

Registered in England and Wales with Company Number 07625370 | VAT Number 113 1740 61
6-8 Hills Road, Cambridge, CB2 1JP. All material © Cambridge Intelligence .
Privacy Policy | Security Framework
