Whether it’s Bitcoin’s value fluctuations, million-dollar hacks, the launch of new currencies or stories of regulators grappling with a brave new world, barely a week passes without cryptocurrencies hitting the headlines. They’re widely regarded as the future of finance, so it’s no wonder people want to learn more. Let’s look at how our network visualization toolkits can help you make sense of cryptocurrency transactions. We’ll use Bitcoin data throughout, but the concepts of visual Bitcoin analysis could also be applied to other cryptocurrencies.
What is Bitcoin?
While governments and banks still dislike the concept of digital currencies, there’s a huge business opportunity. Compared to traditional fiat currencies, decentralized cryptocurrencies offer a secure, low-cost way to transfer funds anywhere in the world.
Bitcoin is a digital currency that uses the blockchain to manage and secure transactions. And unlike traditional currencies, Bitcoin is not backed by an institution, like a government or bank. Instead, its value is based on its users’ trust in the system.
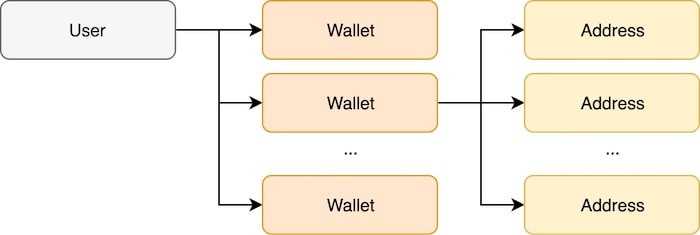
Bitcoin coins are mined and can be sent between users’ wallets as transactions that have input addresses and output addresses. Transactions are contained within blocks. A user can have many wallets; wallets can have many addresses; and addresses can be generated on demand.
To maintain trust within a global financial network of anonymous strangers, every transaction is broadcast to every node in the network. In fact, every Bitcoin wallet contains a record of every single transaction in the history of data, which allows validation of future transactions.
Broadcasting those transactions globally can result in disagreement across the network which could undermine the whole currency, so Bitcoin uses a blockchain solution to maintain and protect the correct order of transactions.
It’s easy to see the value of network visualization. Bitcoin is connected by design, and all the data is in the public realm. The cryptographic references used to represent the wallets, transactions, blocks, addresses, and everything else are easy for computers to read, but not humans. Visual Bitcoin analysis helps people identify transaction patterns and make sense of the endlessly-growing network.
There are several network visualization techniques we can use to visualize and understand Bitcoin transactions. In all of the following examples, we used data from blockchain.com’s API.
Bitcoin network visualization
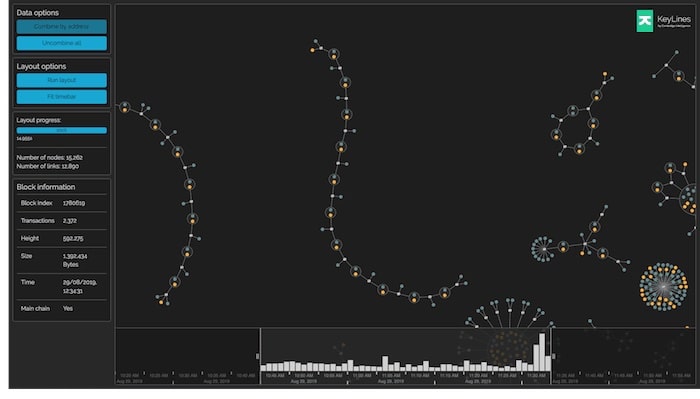
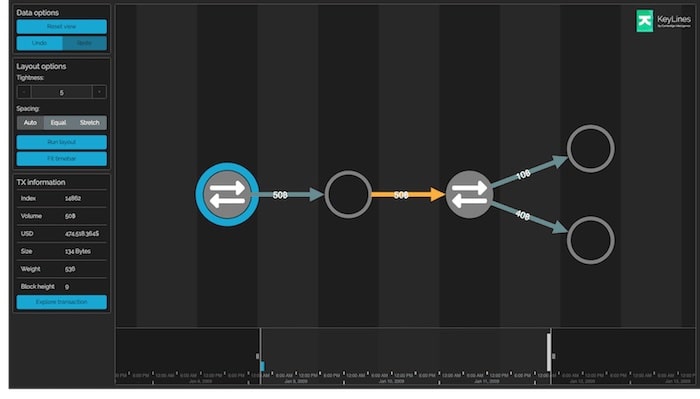
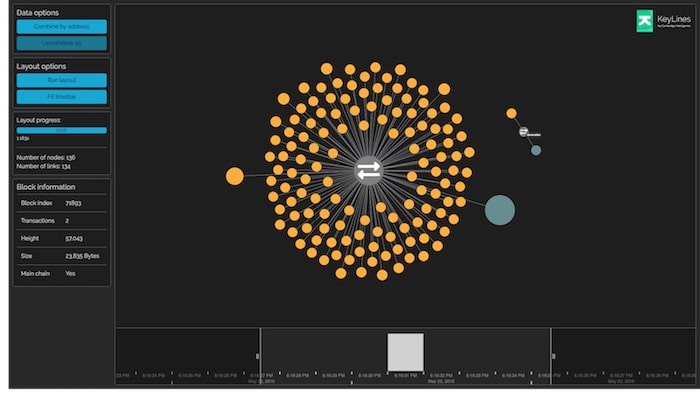
Here’s a block, visualized with KeyLines.
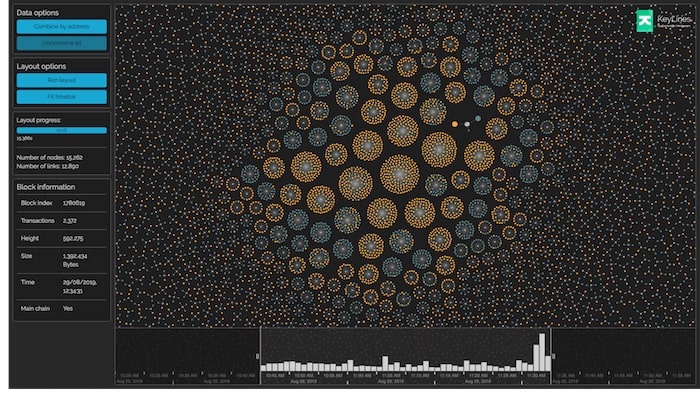
In our model, transactions are represented by grey nodes with a double arrow icon. Inputs to these transactions are shown in orange, and outputs in teal. We’ve scaled nodes by their value. The time bar shows the count of transactions over time. Although this view looks pretty, it gives little insight into the data.
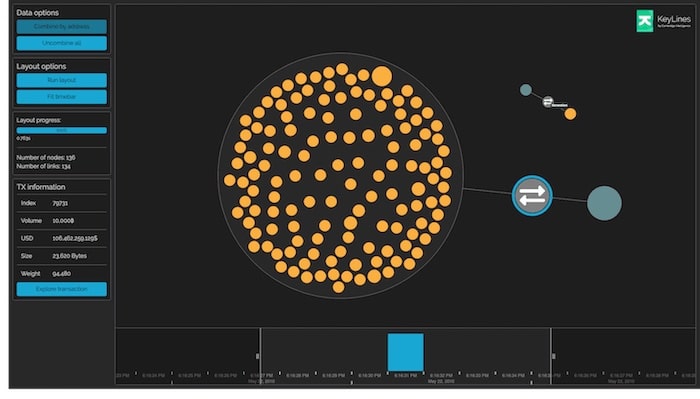
Bitcoin transactions are public but anonymized. To protect that anonymity, users commonly generate a fresh address for every transaction, but not always. For reasons of convenience, indifference to anonymity or unawareness, around half of the addresses in a typical block are reused.
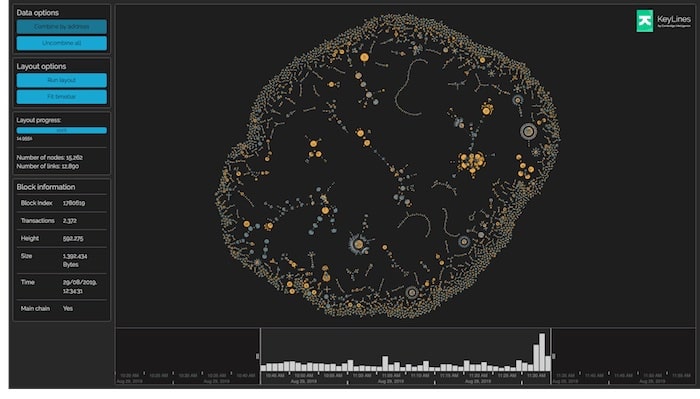
That means we can group transaction inputs and outputs by address with the guarantee that all nodes in a group are controlled by the same user, to reveal some more interesting patterns:
Identifying automated Bitcoin transactions
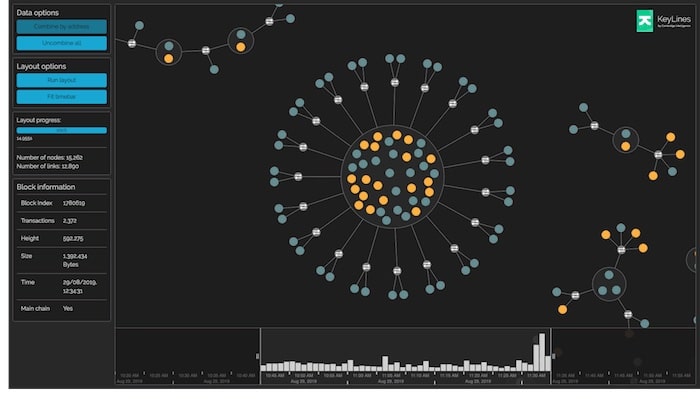
Here, a single address is sending bitcoins to lots of other unique address pairs. Each of these transactions has exactly one input (orange) and three outputs (teal), with one of these outputs returning (potentially as change) to the sending address.
The next pattern shows rapidly-spent outputs. For each transaction in this chain, a small amount of the input is siphoned off to a different address, and the remainder is used as input to the next transaction in the chain. All of these transactions happened in a 5-minute window.
These charts show unusual patterns that could be completely innocent. Armed with more data and heuristics, however, an analyst could discover something more interesting.
Identifying manual Bitcoin transactions
Zooming into a different area in the block, we can see a new collection of patterns which probably indicate the transactions were manual rather than automated.
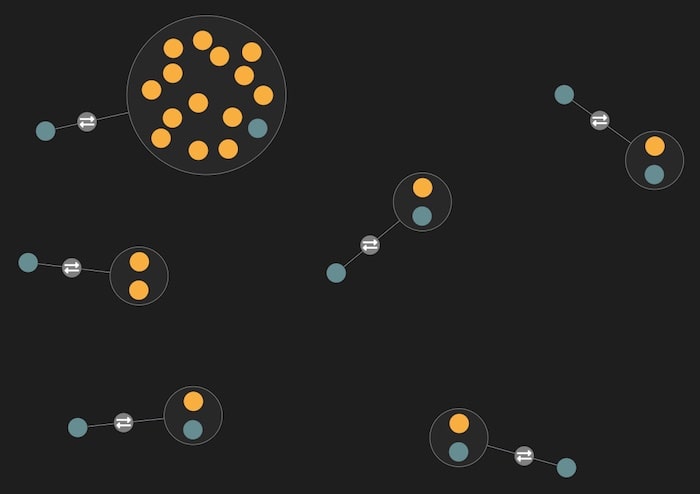
What makes us believe these transactions aren’t automated? There are certain characteristics that suggest (but do not guarantee) that these transactions were manually orchestrated:
Disconnected transactions: these transactions do not share any addresses with other transactions in their block.
Exactly two unique addresses, suggesting that the transaction was between two parties.
Output to an address that was also an input, suggesting that this is a ‘change’ output, which is typical when transacting with another party.
And finally, we notice infrequent and irregular timings.
Visualizing all transactions in a single block might seem uninteresting. After all, a block (mostly) contains transactions from a small time window, with no structure beyond that.
However, as we’ve seen, taking a time-bound set of transactions and visualizing it in a single chart can be a useful detection technique for uncovering patterns and anomalies that require investigation. It’s widely used by fraud analysts.
While visualizing an entire block can be interesting, and useful for understanding transaction patterns and anomalies, it can also be restrictive.
A different approach is to explore individual transactions and how they link to other transactions in other blocks. Let’s try that out, now that we have the basics of Bitcoin visualization covered. We’ll use our sequential layout to explore some interesting transactions from the currency’s history.
Why visualize blockchains?
Visualizing Bitcoin transactions
The first-ever Bitcoin transaction happened at block height 170 on 12th January 2009. Before this point, Bitcoin blocks contained no transactions beyond the miner reward.
It was between Bitcoin founder Satoshi Nakamoto and programmer Hal Finney, and follows a typical transaction structure. Here, Nakamoto sent Finney a total of 10 bitcoins, using a 50 bitcoin input and a 40 bitcoin output as change.
Exploring this data in the transaction-centric view reveals some interesting details.
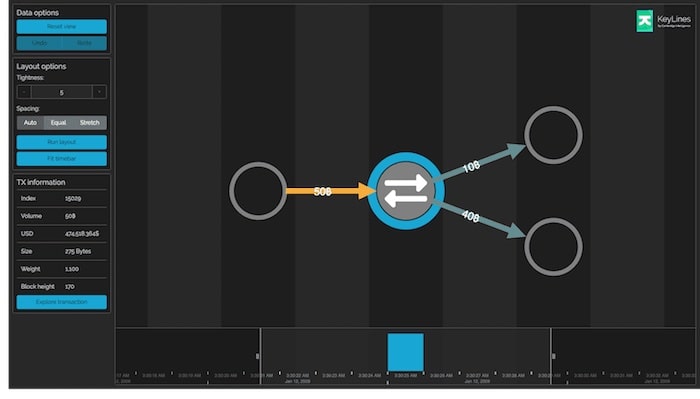
In this visualization, gray nodes with the double arrow icon represent transactions, orange links are inputs and teal links are outputs as before. Filled nodes represent unspent outputs, and empty nodes represent spent outputs.
We can see Nakamoto’s 50 bitcoin input on the left, and Finney’s output and Nakamoto’s change are on the right.
Double-clicking on a spent output will fetch data about that output from the Bitcoin API. This data is then parsed and loaded into the chart, expanding it in place.
This interaction allows the user to explore transaction data through time, both forward and backward, in a controllable, logical way. It’s a powerful technique for investigating specific transactions of incidents, without suffering data overload.
Expanding Nakamoto’s input node, we can see the origins of the bitcoins he transferred to Finney. They originated from the miner rewards for the block at height 9, meaning Nakamoto successfully mined the ninth block in the Bitcoin blockchain.
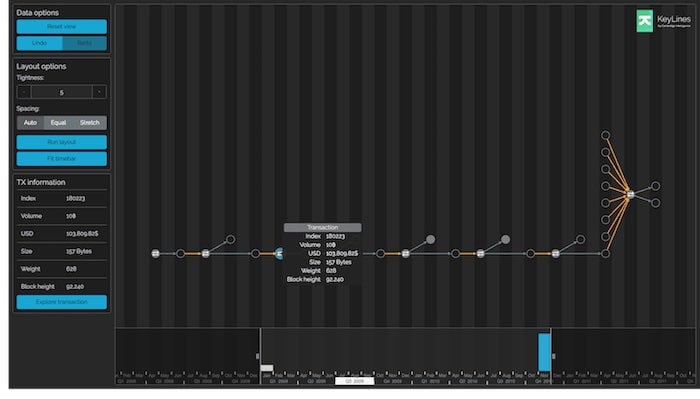
Exploring in the other direction, we can find out how the outputs from this historic transaction were later spent.
First looking at Finney’s output, we can see that this remained unspent until block 92,240, almost three years after he received the funds.
After this point, the outputs were spent in a series of transactions over a short time period. Some of these transactions feature unspent outputs totaling 1.69 bitcoins, the private keys for which could potentially be lost.
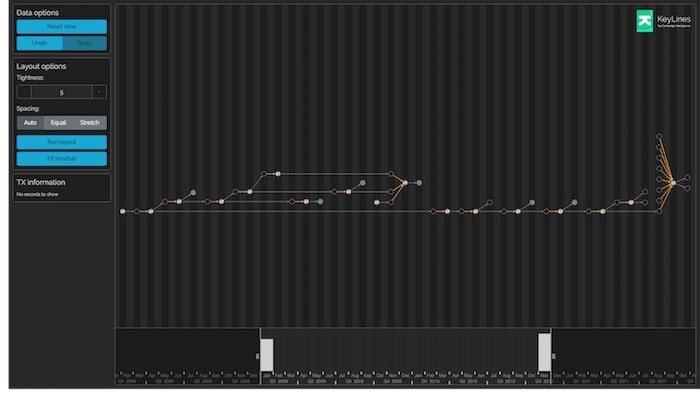
Alternatively, we can expand Nakamoto’s side of the transaction. Shortly after the initial transaction, he made a 10 bitcoin payment to another address, which has not yet been spent.
This left Nakamoto with 30 bitcoins on his address, and he immediately went on to pay 1 bitcoin to yet another address. Following this, Nakamoto made a series of further transactions, leaving him with 18 bitcoins on this address of his, which remains unspent to this day.
It is worth noting that the reason we are able to gain this level of insight is because this transaction was announced and the participants were known. The cryptographic addresses involved could be associated with the users behind them.
Let’s look at another notable transaction from Bitcoin’s history.
The $100,000,000 pizza
On 17 May 2010, Laszlo Hanyecz posted a request on a Bitcoin forum. He was offering to pay 10,000 bitcoins, then worth about $41, for two pizzas.
On 22 May 2010, fellow forum user ‘jercos’ took him up on the offer and ordered the two Papa John’s pizzas. Laszlo couldn’t know at the time that, had he kept the bitcoins instead of buying two pizzas, he would have been $100,000,000 richer today. Proof of this historic purchase can be found in the following block:
00000000152340ca42227603908689183edc47355204e7aca59383b0aaac1fd8
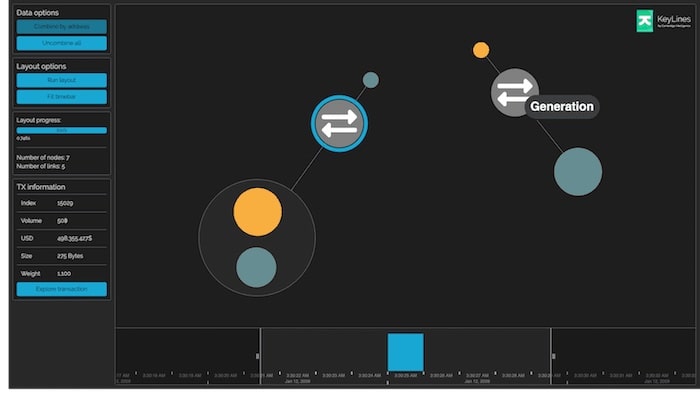
In this block, there are two transactions. The first one is the pizza payment transaction from Laszlo to jercos. The second is the generation transaction: the reward for the Bitcoin user who successfully mined the block.
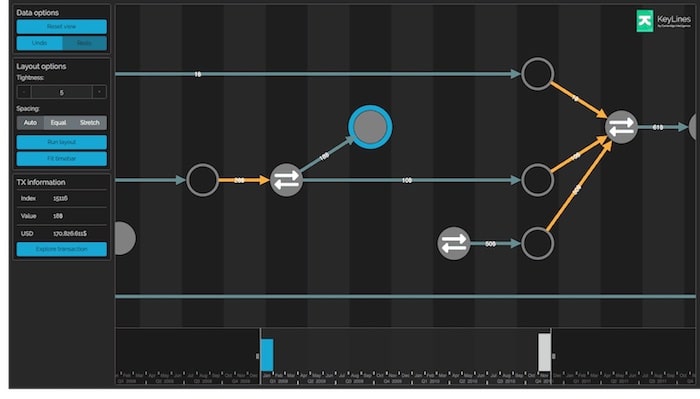
Let’s visualize this block with KeyLines:
Grouping nodes that share an address gives a clearer picture:
The structure is immediately clear. Laszlo used multiple unspent outputs from previous transactions to one of his addresses as inputs to the pizza transaction.
At the time of writing, if Laszlo had saved the original bitcoins, he would have been able to order 6 million Papa John’s extra-large pepperoni pizzas, leaving a sizeable tip for the delivery driver. He should probably have kept hold of them.
Visualize Bitcoin transactions with our toolkits
The great thing about Bitcoin is all the data is publicly available, meaning anyone can create a Bitcoin transaction visualization and explore it for themselves. Our graph visualization toolkits make it quick and easy to build powerful visualization tools that can be deployed to unlimited end-users, anywhere in the world.
Want to try them for yourself? Request a free trial of our data visualization SDKs


