How graph databases work
Watch this helpful 30-minute video on how to visualize graph data.
Graph visualization expert, Corey Lanum, explains how graph databases, like industry-leader Neo4j, work and how our award-winning toolkits can help you make the most of them. This is suitable for both technical and non-technical audiences alike.
How to visualize graph data

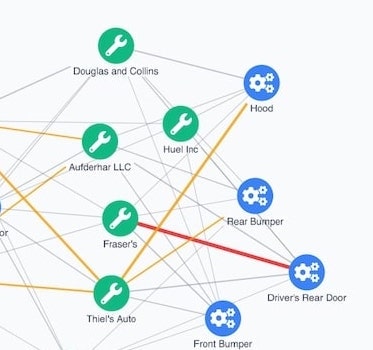
A graph is a model of data that features connections (called links or edges) between entities (called nodes or vertices) and properties.
If you want to represent your data as a graph, the high-level process is simple: identify which entities you want to represent as nodes and links and then apply them. As long as you have connections in your data, even two simple columns are enough to get value out of looking at it in a chart. But in reality, your graph data is likely to be far more complex.
A graph database schema already has node, edge and property graph structures built into them. They’re optimized for the job of representing graphs, with connections in a graph database as important as the data itself. Once you translate the nodes, links and properties into the real-world representations in your visual model, you can use graph visualization to find new insights.