
Transform connected data into interactive visualizations

Data visualization SDKs proven to perform in mission-critical software.

Timeline Visualization
Graph Visualization
Geospatial Visualization

A new perspective on complex data

Build products that inspire users, reveal insight and perform at scale.

  • Inspire users

    Inspire users with beautiful visualizations that make sense of complexity and deliver clarity from the first interaction.

  • Empower exploration

    Transform visualizations into interactive tools users rely on to uncover patterns, understand connections and gain insight faster.

  • Connect every dimension

    Add graph, timeline and geospatial visualization to your product – and combine them to reveal how people, events and places connect.

  • Build with confidence

    Build products you trust to perform in the most high-stakes environments, with proven technology that’s reliable and ready to scale.

Where interactive intelligence makes the greatest difference

Our SDKs bring interactive intelligence to critical situations where every decision counts – turning fragmented information into intuitive, connected experiences that help teams detect, investigate and respond with confidence.

Visualizing cybersecurity connection
Cybersecurity

Visualize identities, behaviors and attack paths across your digital environment. Help analysts spot anomalies and trace threats through complex infrastructure with speed.

Risk and compliance
Risk and compliance

Assess risk across people, transactions and organizations to strengthen compliance, detect fraud and money laundering, and meet regulatory requirements.

Security and intelligence

Unify intelligence from communications, devices, locations and events to uncover threats, expose criminal networks and support investigations across intelligence and law enforcement.

Built for developers. Loved by teams.

Our SDKs are engineered for teams who need to build powerful visualization features quickly and confidently – without compromising performance or flexibility.

Fast to market

Ship production-ready visualization features without weeks of groundwork. Our SDKs provide layouts, interactions and rendering logic out of the box, so teams can move from concept to live software quickly, without building and rebuilding a custom visualization layer.

scale icon

Proven to perform

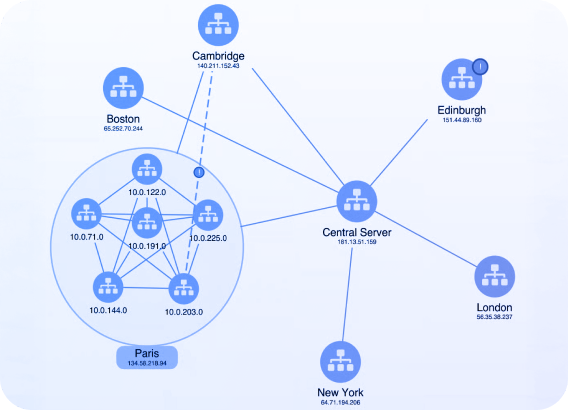
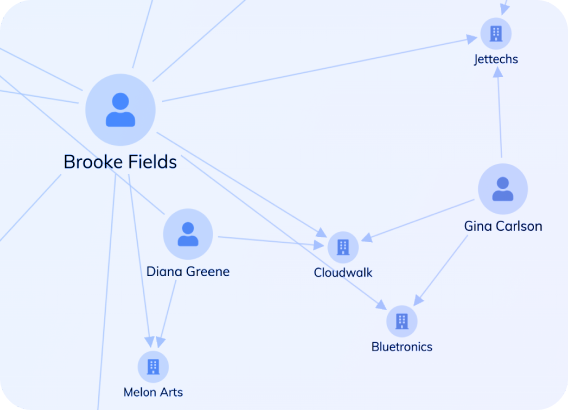
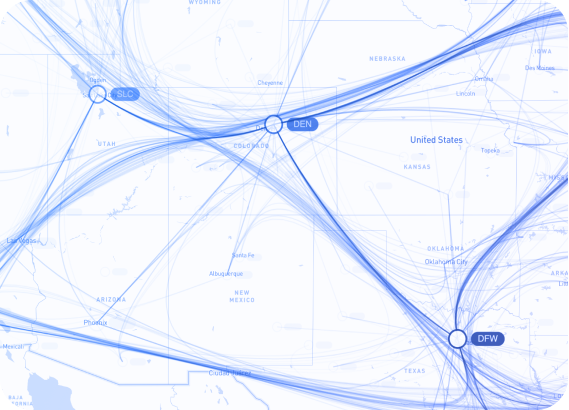
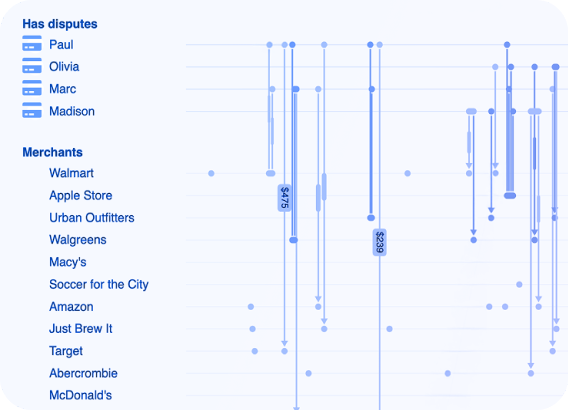
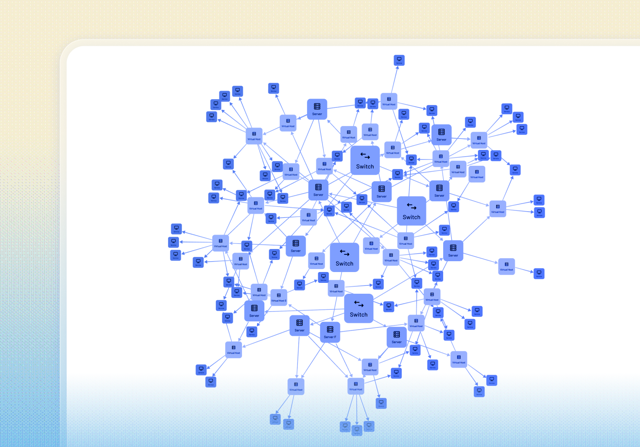
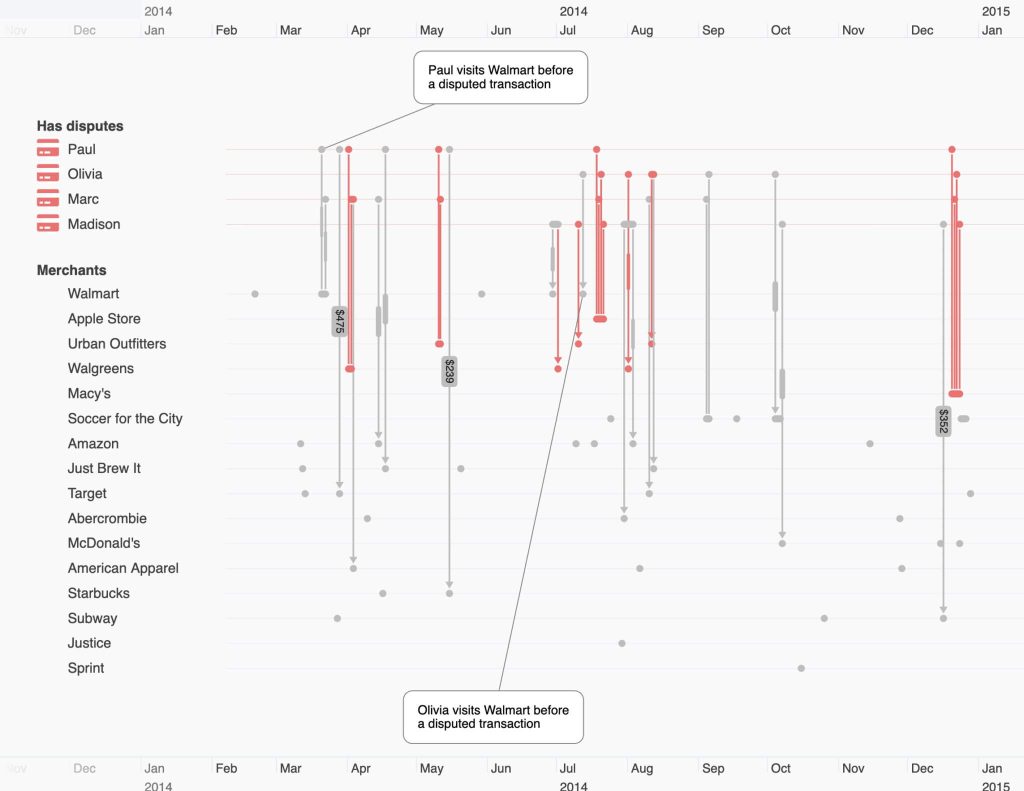
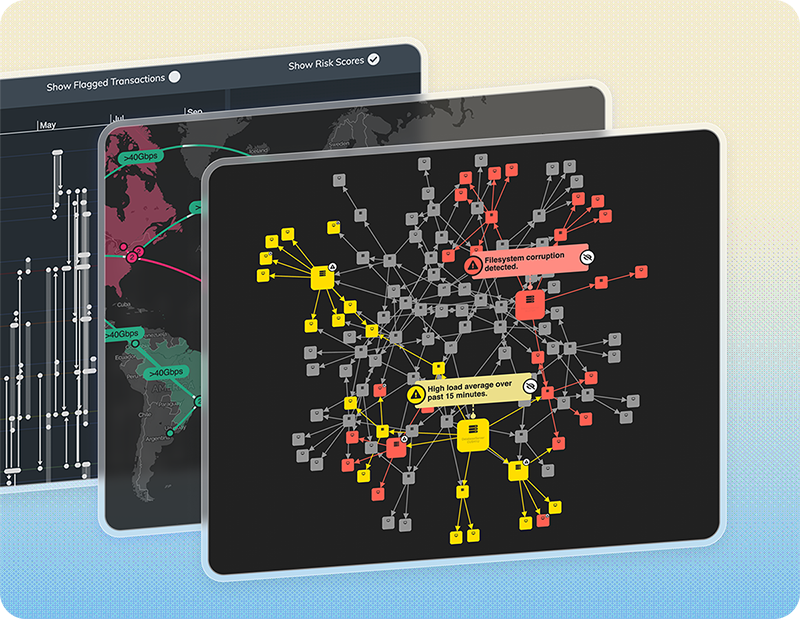
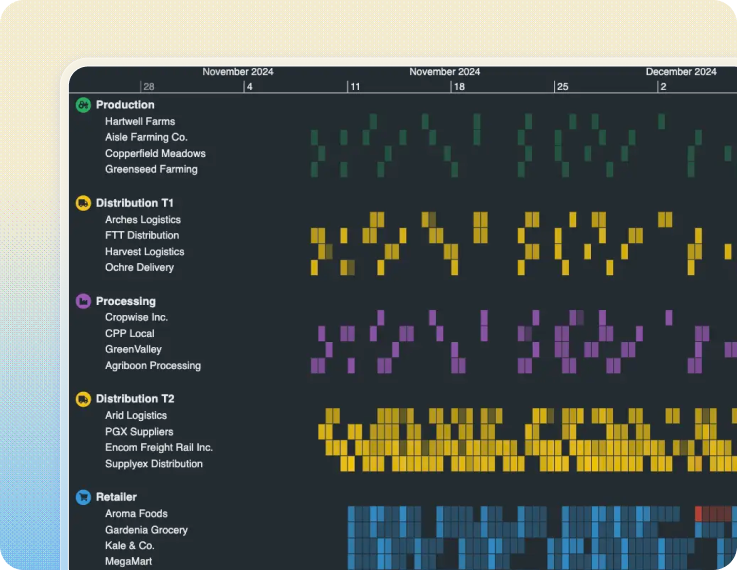
Our toolkits are designed to handle large, complex, and fast-changing datasets without degrading performance or stability, even when combining graph, geospatial and temporal views in the same application.

Loved by engineers

Our SDKs offer well-defined APIs, flexible configuration, and predictable behavior, giving developers control over how visualizations are built, debugged, and maintained. They integrate cleanly with existing tech stacks and are database agnostic.

Visual intelligence for every dimension of connected data

Choose the toolkit you need. Each SDK includes comprehensive docs, live showcases, and an interactive playground to help you evaluate and build quickly.

KeyLines

KeyLines

The JavaScript SDK for graph visualization

ReGraph

ReGraph

The React SDK for state-driven graph visualization

MapWeave

MapWeave

The geospatial visualization SDK for uncovering hidden connections

KronoGraph timeline visualization

KronoGraph

The timeline visualization SDK for investigating event data at scale

Why choose Cambridge Intelligence

Because the products you build deserve visual experiences that are fast, clear and intuitive, even when the data gets difficult. Our SDKs are designed around the principles that matter most to mission-critical software.

Trusted to perform

Fast, responsive and reliable – even when your data becomes large, complex or highly connected.

Clarity in complexity

Beautiful visual intelligence designed to reveal insight, not noise – helping users see what matters quickly and confidently.

Intuitive by design

Natural, free-flowing interactive patterns built around how people think, not how your data happens to be structured.

Speed to action

Visualization tools that help users move from discovery to decision – and decision to action.

Frequently asked questions

Are your SDKs proven in mission-critical environments?

Yes. Our technology is trusted by more than 250 organizations building high-stakes intelligence, cybersecurity, government and financial software. These teams rely on our SDKs for performance, reliability, security and stability.

What’s included in a trial?

You get full access to the SDKs, documentation, showcases and support from our engineering team. Enough to evaluate, prototype and share internally.

How quickly can my team get value from your SDKs?

You can start exploring our visualizations in minutes using the playground to get a feel for the interactions, design and data handling. Most teams build working prototypes in just a few weeks. Our demos, docs and support reduce development risk and accelerate your path to production.

Will this work with our application and tech stack?

Yes. Our SDKs fit into modern JavaScript and React applications, whether you’re integrating visualizations into an existing product or building something entirely new. They work with your current tech stack, connect to any datastore, and scale with your project as it grows.