Tell the story in your data
with flexible, collaborative annotations
Add a new layer of meaning to your chart
When you visualize connected data, you simplify its complexity and make it easier to understand. You can take that one step further with an annotation layer that explains the narrative in your chart.
This page explains how our annotations work, and how they enhance graph and timeline visualization applications.
A part of the end-to-end workflow
Data visualizations aren’t standalone tools that get used once and forgotten. They’re part of a wider workflow that starts with a question and ends with a conclusion that everyone agrees on.
Annotations make visualizations more collaborative, insights more shareable, and presentations more engaging and meaningful.
Enhance communication and collaboration
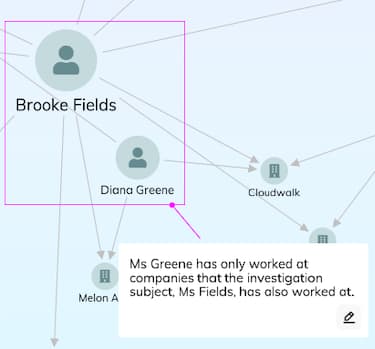
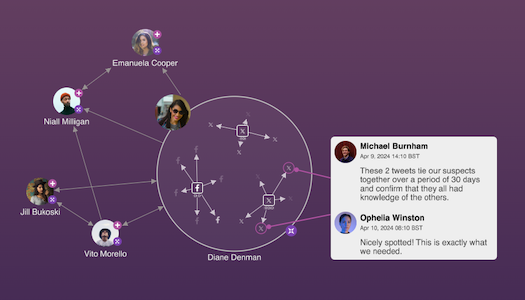
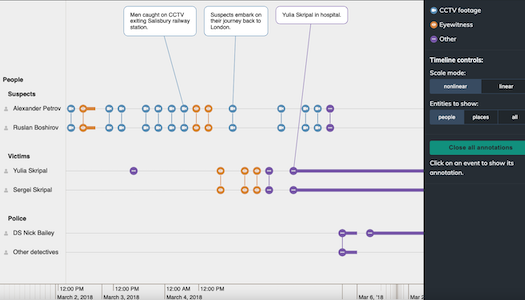
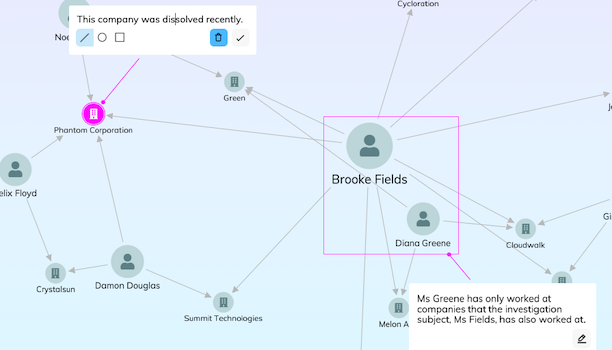
Annotations faciliate cross-team collaboration at any time, anywhere. Users can add their observations, questions, conclusions and insights – their human narrative – to any part of the visualization. Add them to a single node or event, or an entire sequence of activities, without ever leaving the chart. The visualization itself becomes a repository of shared knowledge, contextual information and subject matter expertise.
Generate more meaningful reports
When it’s time to share a report, presentation or to present evidence in a formal process – the annotations layer highlights the insights that led the analysts to their conclusion.
It makes their recommendations and insights instantly understandable and explainable to anyone, removing any ambiguity.
A digital highlighter
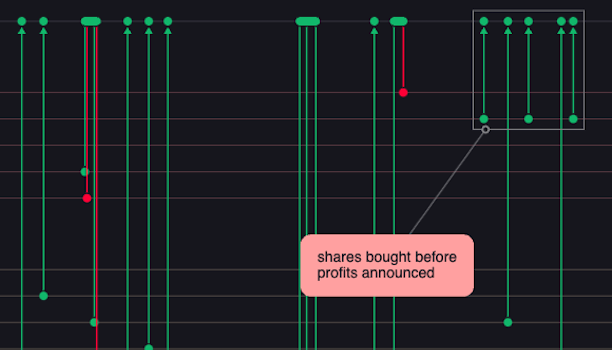
When you’re reading a report, you might highlight key information, adding comments as you go. You can use the annotations layer to do the same thing, like a digital highlighter for graph and timeline visualizations.
Users can interact with their data visualizations to uncover insights, and apply their skills, knowledge and expertise to pick out the important parts of the underlying narrative.
Add annotations at any stage in the investigation
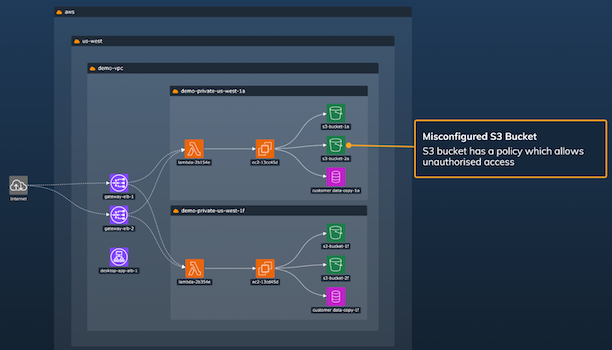
Annotations can be user-driven or machine-driven: populated by the analyst during their investigation or analysis workflow, or generated directly from the data.
The annotations layer lets users add a commentary or a narrative that helps them collaborate, and share insights with that explain the full story behind the data.