The latest versions of our graph visualization toolkits, KeyLines and ReGraph, bring new flexibility to node customization, with the ability to add images to labels. There’s also improved support for images and font icons, plus updated getting started tutorials for modern front-end tooling.
Make node labels more meaningful with images
Advanced node styling capabilities make it easy to realize any product design vision without compromising on the perfect look and feel. We’ve now taken that one step further with the ability to include images in labels.
When you use image labels, it makes nodes instantly recognizable, more meaningful and unique. Along with other features for customizing your data, those image labels help to simplify complexity and create more accessible graph visualizations.
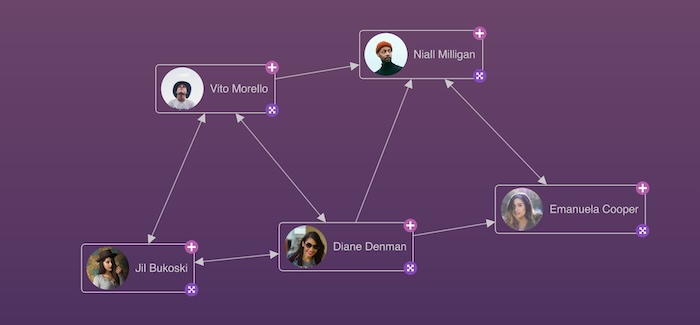
Image labels also give developers more flexibility around the formats they can use to supply assets to the toolkits.
To see image labels in action, head to the KeyLines SDK’s Advanced Node Styles demo, or the ReGraph SDK’s Advanced Node Gallery story.
Greater image & font icon support
We’ve increased the number of images and font icons that our toolkits support in WebGL. The limit imposed by the user’s own hardware is the only one that applies.
Modernized getting started tutorials
Open-source build tool Vite is a popular choice for developers looking for easy integration and fast performance. To reflect this, we’ve updated our getting started tutorials to use Vite.
KeyLines users will also see improved JavaScript and Angular tutorials, with details on raw data transformation, chart styling options, and easy-to-copy code snippets.
Ready to give graph visualization a try?
If you’re using KeyLines or ReGraph already, head to the release notes on the SDK sites for details of additional fixes and enhancements. Or if you’re starting a graph visualization project and think our technology is right for you, request a free trial today.

FREE: Start your trial today
Visualize your data! Request full access to our SDKs, demos and live-coding playgrounds.


