Our graph visualization toolkits deliver advanced node styling capabilities and almost limitless customization options, making it possible to realize any product design vision without compromising on the perfect look and feel.

Get a contemporary aesthetic with rectangular nodes
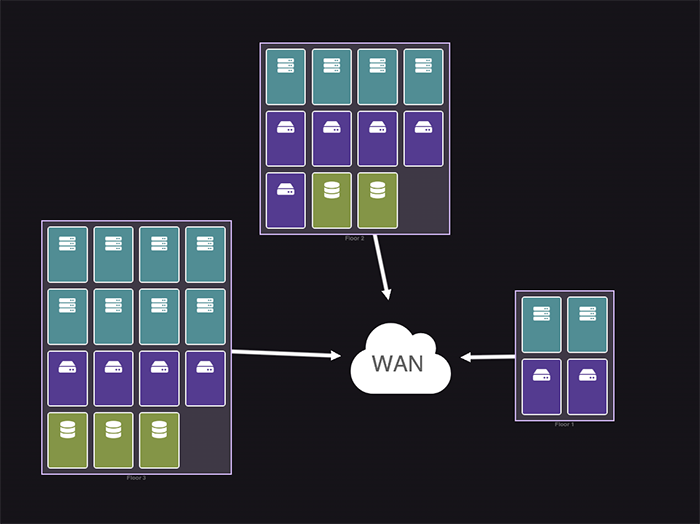
To complement sleek and modern designs with KeyLines and ReGraph, use rectangular nodes. These can be styled to have one or more rounded corners, and have the same adaptive abilities and behavior as the default circle nodes our customers are used to.
As well as bringing a modern look to your application, they offer much more space to display information, and they stack beautifully in combination with our rectangular combos or with our sequential layout:


Ready to take your node design to the next level?
With multiple labels and an extensive label styling API, nodes can be better-looking and more information-rich than ever before. They can even become user interface elements, with custom interactions and dynamic status indicators.
Smart labeling reveals ‘detail on demand’, helping users get the right information at the right stage of their investigation:
Buttons with custom interaction styling allow the user to edit or remove a node – or visit an external site for further information:
And in this example, rectangular nodes neatly stacked in a rectangular combo feature dynamic status bars. These allow the user to track data as it evolves, using color coding to add extra meaning:

What designs can we help you build?
It’s easy to get up and running with KeyLines and ReGraph: we can give design teams the expert tech support they need to explore what’s possible for their project. If you can dream it up, we can help you build it.
All of our data visualization toolkits include demos, a live-coding playground and detailed developer documentation. Find out what’s possible with the world’s best graph visualization libraries.


