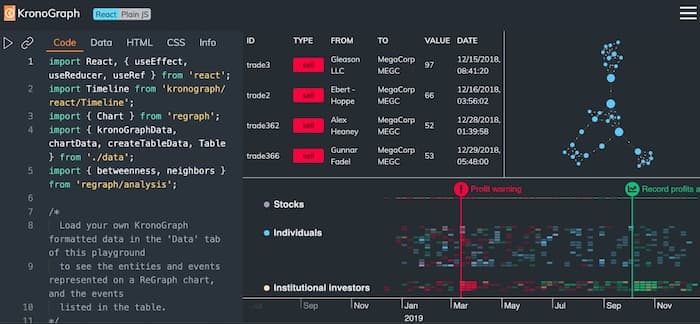
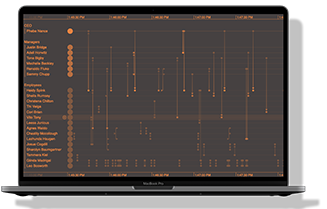
The latest version of KronoGraph, our timeline analytics toolkit, features something unique. For the first time, we’re providing a fully-editable showcase to demonstrate three different views. The result is a powerful application that shows every aspect of your data in one visualization.

Customize multiple views of your data
The new Integration Playground showcase combines a KronoGraph timeline with a graph and table view. It demonstrates how to sync up with KeyLines or ReGraph, our graph visualization toolkits, to support network and link analysis in your timeline investigations.
We’ve included some of the most popular KronoGraph features – markers, event selection, the heatmap, and more – to inspire you to design your own time-based analysis tool.
Reusable, fully-documented code
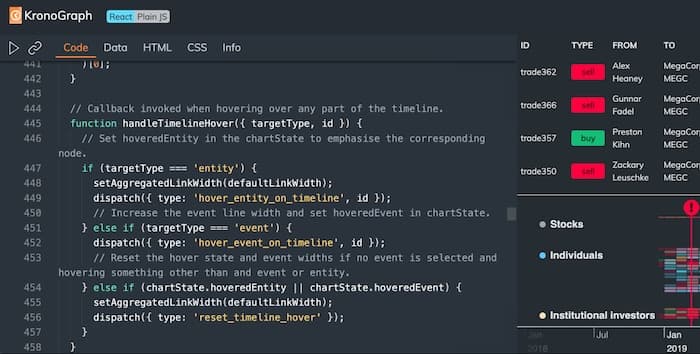
You can access the full code behind the dashboard, with comments throughout to help you understand every line. This saves you having to code from scratch, and is an easy way to try out alternative styles and interactions.

You could even add your own KronoGraph-format data to see how it’d look in the dashboard. It offers the quickest path to building a custom demo to showcase ideas to the rest of your team or organization.
Want access to the KronoGraph SDK?
The Integration Playground showcase is now available from the KronoGraph SDK, where you’ll also find details of the latest fixes and enhancements. If you’re not a KronoGraph customer already, request a free trial today.


