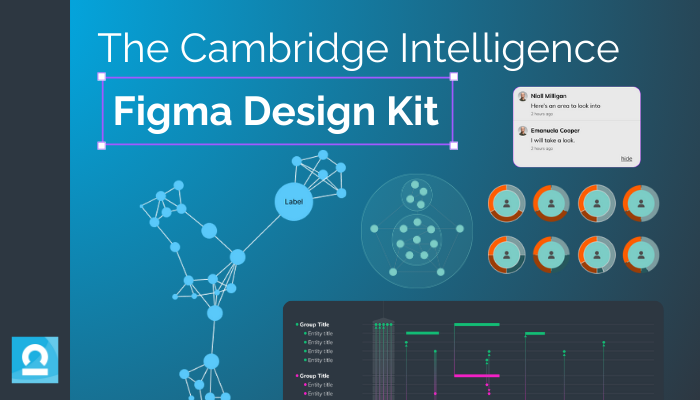
Design beautiful, intuitive and fully-customized graph and timeline visualizations with our Figma Design Kit.
Crafted by our data visualization experts, the kit accelerates the design cycle, helping you quickly prototype and refine user-friendly interfaces.
From design to developer handover, the kit makes every step faster and easier.
Now available in Early Access for customers and evaluators. Speak to your account manager or request a trial today to unlock smarter, faster visualization design.
Getting started with the Figma Design Kit
Starting a graph or timeline visualization project can be daunting. With only a blank page in front of you, where do you begin?
Our Figma Design Kit makes it simple.
Designed for rapid prototyping, it offers 100+ ready-made components and application designs to save time and bring your graph and timeline visualization ideas to life.
You’re probably already using Figma, so there are no steep learning curves. Just intuitive, flexible components ready to use from day one.
Here’s a guided tour of our new Figma design kit by the designer who created it.
Accelerated designs, from concept to code
Start strong with beautiful templates
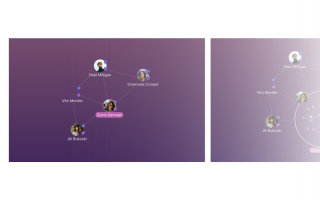
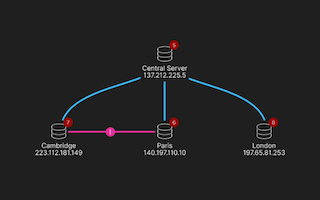
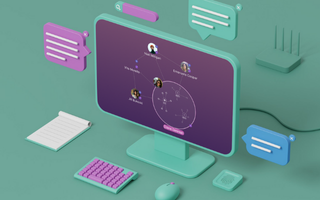
Our Figma Design Kit includes fully-featured templates based on our most popular SDK demos. They’re perfect for overcoming the blank-page problem, starting your graph and timeline visualization designs on a strong foundation.
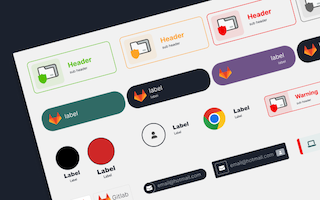
Explore 100+ stylable components
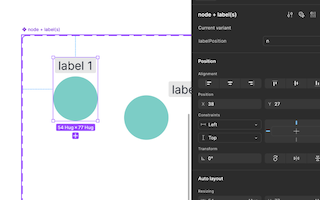
The Design Kit comes with 100+ pre-built components, including nodes, links, timelines and annotations, for you to test ideas without a single line of code. Reusable and adaptable, you can use these elements to tailor visualizations to your users’ needs.

Design with the tools you know and trust
We’ve made it easier to create stunning visualization designs in Figma, combining its native functionality with our own guidance and helpful navigation panels. Branding is a breeze, too. Change a component once to see the updates applied across your design, or use Figma variables to apply your own branding across the entire component library.
Make the most of the API
Our SDKs contain dozens of features and near limitless design options. The Cambridge Intelligence Figma Design Kit is an easy way to explore them all, so designers can harness the full power of our toolkits, and developers can quickly make them a reality.
Impress with polished, intuitive designs
Once you’ve defined your styles, the Figma Design Kit helps you create presentation-ready mockups that resonate with customers and stakeholders. Incorporating visualization best practices, the kit guides you towards intuitive, user-friendly designs based on solid best practices.
Easy developer handover
The handover from designer to developer can be challenging. We’ve made it easier: the Figma Functions align directly with our APIs, so your developers can hit the ground running to turn your designs into demos.
Ready to get started?
The Cambridge Intelligence Figma Design Kit is currently available to customers and evaluators only, as part of our Early Access program.
- If you’re a customer or evaluator, simply contact your account manager.
- If you’re not a customer or evaluator, request a trial here to get started.
We’re keen to hear your feedback on the Figma Design Kits during Early Access, and may reach out for your thoughts.
More UX design resources from our blog

A guide to color theory for data visualization
We explore color theory for data visualization and how the right colors will make your app look good and make your data more compelling.

Building accessible graph visualization tools
How to build graph visualization tools that are accessible to all your users, including keyboard shortcuts and selecting appropriate colors.

The basics of graph visualization UX design
Discover our five top UX tips for building beautiful graph and timeline visualizations that look great, work well and don’t overwhelm your users.

Graph visualization challenges: fixing data hairballs
Tips to ensure your graphs don’t become hairballs – networks so dense, that they cannot be usefully visualized.

Graph visualization challenges: dealing with starbursts
How to avoid presenting users with a starburst – when one well-connected node dominates your visualization.

Graph visualization challenges: see through snowstorms
Our guide to preventing the snowball effect – masses of disconnected entities that won’t reveal insight.