
Summary:
Snowstorms happen when graph data is underconnected – producing charts full of isolated fragments that don’t reveal insight. To make these visualizations meaningful, enrich the data with real-world context, aggregate related entities, and use entity resolution to merge duplicates. Grouping and simplifying nodes (e.g., with combos) transforms a disconnected blizzard into clear patterns and relationships analysts can investigate.
This is the second in a series of posts exploring the typical challenges you face when building a knowledge graph or visualizing graph data for the first time.
Part 1 looked at how to fix ‘the hairball‘; and part 3 explores ‘the starburst‘. This time, we’ll look at ‘the snowstorm’ – charts filled with disconnected entities.

Where do snowstorms come from?
In our previous post about hairballs, we discussed how losing focus on the end-user’s workflow leads to overconnected and tangled visualizations. Snowstorms, however, arise from the data model decisions made before the graph is even created.
Graph databases are popular, but we know that many of our customers rely on more traditional relational databases, often augmented with data imported directly from CSV files or spreadsheets. This kind of data suffers from a very different problem – it is typically underconnected rather than overconnected. Attempting to view it as a collection of nodes and links will lead you into a snowstorm.
Let’s look at a typical example. Here’s a small fragment of the ransomware tracker dataset from abuse.ch. It lists observations of the top three ransomware families from January to April 2016.
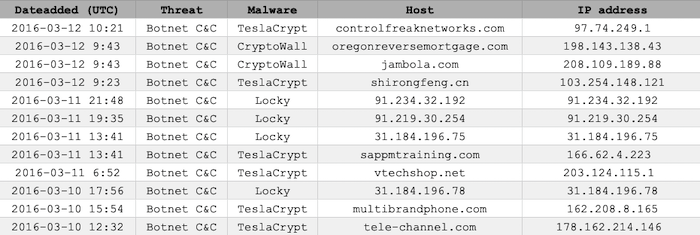
Each row of the spreadsheet corresponds to the identification of a particular ransomware botnet, controlled from a host site with an associated IP address. The dataset runs into the thousands of entries.
It’s a fairly standard table, and at first it’s not clear how you’d translate it into a graph. We might start by attempting to link each botnet controller host with its observed IP address. Putting this into a graph visualization engine such as KeyLines or ReGraph gives us our first snowstorm.

The only patterns that stand out are the star-like snowflakes on the left hand edge. These correspond to cases where more than one host website shares a common IP address. We’ve basically just tried to visualize a DNS lookup table as a picture – there’s really nothing of interest to see here.
We see this situation a lot. Companies and organizations are never short of data, but they tell us “it’s not the right kind of data for graph visualization”. All too often, people give up at the first sign of a snowstorm.
Finding a path through the blizzard
There are many solutions to the snowstorm problem but we’ll focus on some of the most common: enrichment, aggregation and entity resolution.
Enriching your data
To enrich a datasource, you need to combine it with information gathered from one or more secondary sources. It’s one of the principal tools in any investigative workflow.
In some cases, where organizations have big data aggregation projects, this enrichment may have been done on the backend in advance. Often it can be a manual or semi-manual process. In many cases the multiple data sources don’t come together until the analyst connects them in their user interface.
An investigative organization’s enrichment sources are their most prized possession. In the case of our botnet controllers, we’ll use an obvious open-source option – the countries associated with each IP address.
We can visualize this in a number of ways. Let’s keep it simple and display the country next to the IP address using a glyph – a quick and easy way to communicate different characteristics and add decorations to items in your network.
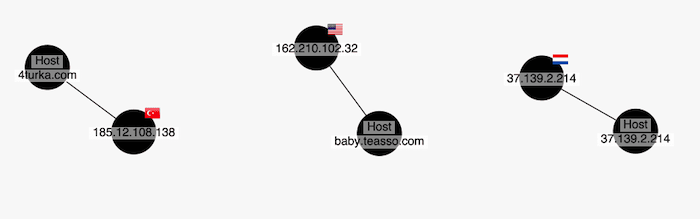
It’s not bad, but it hasn’t helped our snowstorm. Let’s combine enrichment with our second technique – aggregation.
Aggregating to declutter charts
We use combos – our advanced grouping feature – to combine the host nodes by ransomware family, and the IP addresses by our newly-enriched country information. We also size the combos based on the number of items they contain.
We now have a very different, and much more useful, chart.
We immediately see the relationships between countries and ransomware families. We can see which countries had the most botnet controllers (US and Russia) and which countries have all three families in common (Spain, France and the UK).
If we need the underlying data back, no problem. We can open up a combo of interest and look inside. Here I’ve opened the Russia combo node, and by playing back the data sequence using our time bar feature we can watch how the Locky Ransomware botnet infection evolved.
The art of entity resolution
When we used an IP address to aggregate those hosts into countries, we were lucky to have what the intelligence community sometimes calls a strong selector – IP addresses provide (fairly) unambiguous location data.
We’re not always that fortunate. Take a look at this excerpt from the US Federal Election Commission website which lists individual contributions, and only tracks the donor’s name and state. I’ve searched for a common name – John Williams – and filtered by California.
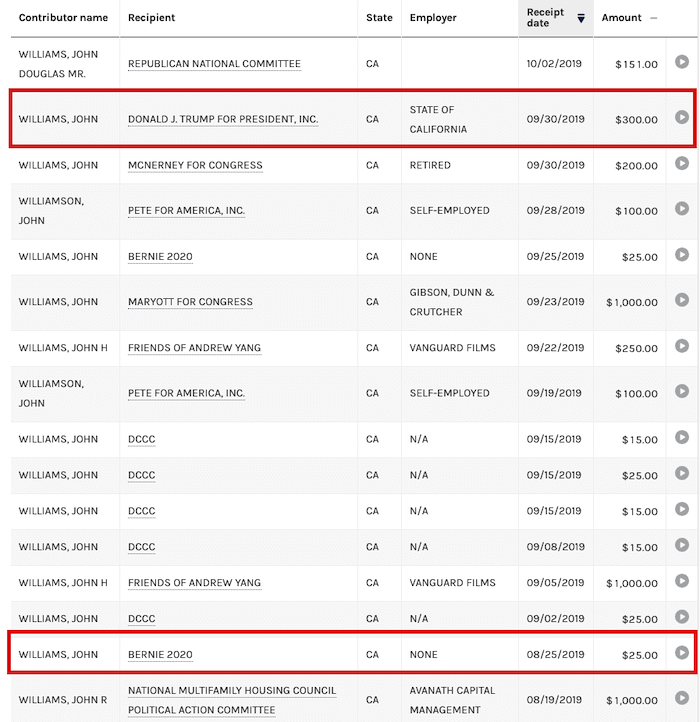
On its own this data is a recipe for the perfect snowstorm. Grouping by state would be an easy win, but it’s tempting to combine these contributions by Contributor Name, so we can see who the most prolific contributors to various organizations are.
A person’s name, though, is very much a soft selector – it’s unlikely that the John Williams who donated $300 to Donald J Trump For President is the same John Williams who donated $25 to Bernie 2020. We don’t even know how many unique John Williamses this dataset contains.
There are a lot of inconsistencies in this data, too. “John H Williams”, “Williams, John Douglas Mr” and so on. This kind of ‘dirty’ data is a big contributor to the snowstorm problem.
The science (or art) of entity resolution – how we resolve these multiple fragments into the correct aggregations – is a fascinating one. If it sounds like a challenge, that’s because it is.
If enriching the data isn’t an option, you’re left with educated guesswork. It’s here that tools like Machine Learning can play an interesting role.
Take a look at some of the patterns in the FEC data. Some individuals make small numbers of large donations, while others make regular donations of the same amount at the same time of the month. On this basis, we might be able to form hypotheses about which contributors are really the same person and explore the results using the powerful combos feature of KeyLines and ReGraph.
But that’s for another blog…
Want to create snowstorm-free visualizations?
To turn the connected data in your spreadsheets and relational databases into insightful and beautiful visualizations, simply request a free trial of KeyLines and ReGraph.
Share:
