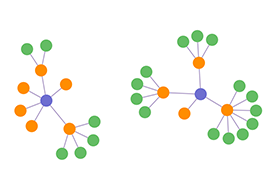
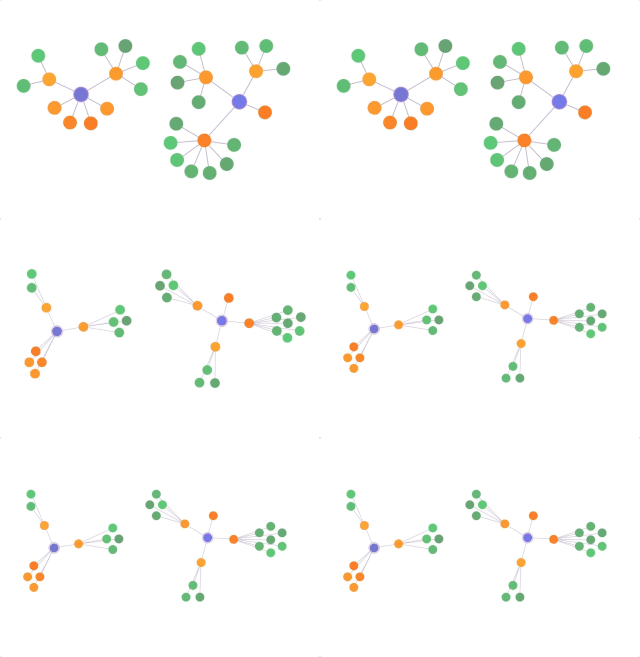
A good graph layout is essential for untangling and understanding any network. We offer many different layouts, each designed to highlight different aspects of your data. They’ve been carefully optimized to ensure consistency, performance and clarity.

Organic Layout
This is a force-directed graph layout designed specifically for your biggest datasets.
It detangles complex networks by reducing node/link overlap and minimizing white space, with multiple components laid out in a circular arrangement with larger components in the center. The organic layout uses clever adaptive behavior to accommodate network changes through small adjustments to the chart, so users don’t lose their mental map of the data. The pattern is easy to understand and helps reveal underlying structures.
Lens Layout
This layout has been designed to push highly-connected nodes into the center, and force the less connected nodes into the periphery, so nodes are arranged in a circular shape.
This results in an attractive ‘lens’ view allowing users to find well-connected nodes more quickly. It’s a particularly efficient way to view large networks.

Structural Layout
This layout is similar to the standard layout, except it groups nodes with similar attributes together in fans. It’s particularly useful to get an overview of the network clusters, or to identify groupings that may not be obvious.
Sequential Layout
Our sequential layout is a good way to display where there’s a clear parent-child relationship between nodes, but where the nodes also have a set tier or level that needs to be communicated.
It takes multiple components into account, minimizes link crossings and makes really efficient use of the available screen space.
Radial Layout
Our radial layout arranges nodes in concentric circles around the original subject in a radial tree. Each generation of node becomes a new orbit extending outwards, showing a dependency chain.
Generally, this is an alternative to sequential layout for tree-like networks with a large volume of child nodes to each parent.
Ready to learn more?
Get started with one of our data visualization products to try these graph layouts for yourself.