After a busy few weeks, we’re pleased to share some of the latest updates to our graph visualization toolkits.
Our focus has been on layouts, with enhancements to help your users uncover insight in their biggest and most complex datasets. KeyLines developers will also benefit from improvements to our SDK and documentation.
Accelerated organic layout
We designed our organic layout to combine performance and quality. It’s capable of detangling your biggest datasets, arranging items around the chart to reveal patterns with speed and simplicity.
We’ve just made it even faster.
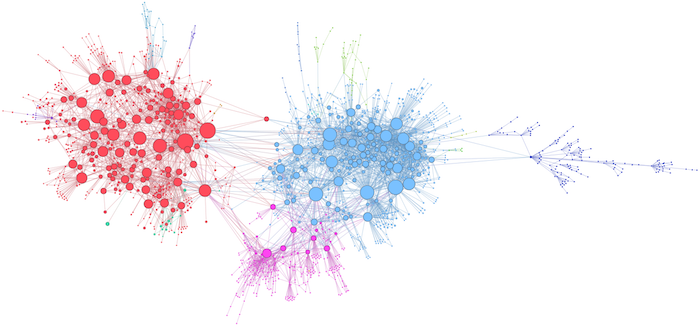
Our typical performance benchmarks show performance increases of 2 to 5 times, and much more in some use cases.
If you haven’t already, we’d recommend replacing your standard layout with the organic layout. We think you’ll be impressed by the results.
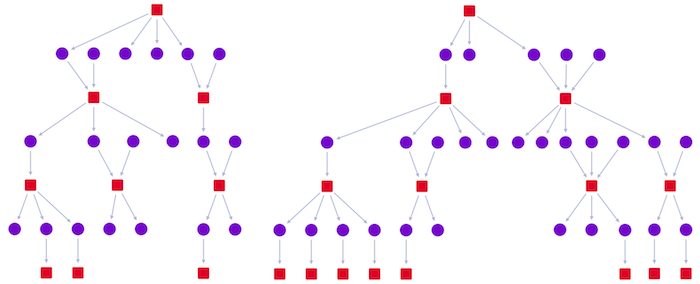
Sequential layout out of beta
Thanks to your feedback during the beta testing phase, the sequential layout is now an established part of our toolkits.
We’ve significantly enhanced the sequential layout. You can now use it on nodes with incomplete or missing level data by simply defining a top node, just like the hierarchy layout. It intelligently places nodes on appropriate levels based on their connected items. It runs more quickly than before too.
Don’t let links be a drag
In a crowded chart, it’s frustrating when a user tries to pan but accidentally selects a link instead.
With our new drag option, you can tell the chart to ignore links, avoiding accidental link selection and delivering a more satisfying experience.
This feature’s in alpha, so try it out and let us know how you get on.
TypeScript and modern JavaScript
We maintain a careful balance between harnessing modern JavaScript in our demo examples and using code that the developers building with our tools are familiar with.
We’ve been modernizing our code examples across the KeyLines SDK, and have just improved our TypeScript definitions for the whole toolkit.
If you’re using TypeScript, you can now benefit from context-sensitive API documentation and intelligent code completion from within your IDE.
Ready to give it a try?
If you haven’t tried KeyLines or ReGraph yet, sign up for a free trial or get in touch to find out how we can help meet your graph visualization needs.


