Many JavaScript developers tell us that they like KeyLines, our graph visualization toolkit, because it’s so flexible. It fits with any browser, device or database, and in any environment.
This blog post tells you how to add a KeyLines data visualization application to your existing Java application, using the ever-popular Spring Java framework.
Why build my web application in Java?
This object-oriented, general-purpose programming language is commonly used for server-side development. Many developers like it because:
- it uses simple coding language with syntax that’s similar to C or C++
- it runs on any platform inside a Java virtual machine (JVM)
- it’s been around since 2005, so there are established online resources if they need help
- it’s great for large-scale, complex backend development
- there are many Java frameworks available that can deal with the heavy lifting
To make our example easier, we’ve chosen Spring from Pivotal, currently the most popular framework for developing and configuring web applications in Java.

About Spring
Spring is a simple, stable and elegant platform for Java applications. It makes the process of building an enterprise web application with rich front-end simpler, faster and much less code-heavy.
There’s a range of detailed Spring projects available, so you can choose which modules to add to your infrastructure. They include Spring Data Neo4j, a project that makes building Java graph applications on top of your Neo4j graph database much simpler.
Step 1: Create a project using Spring Initializr
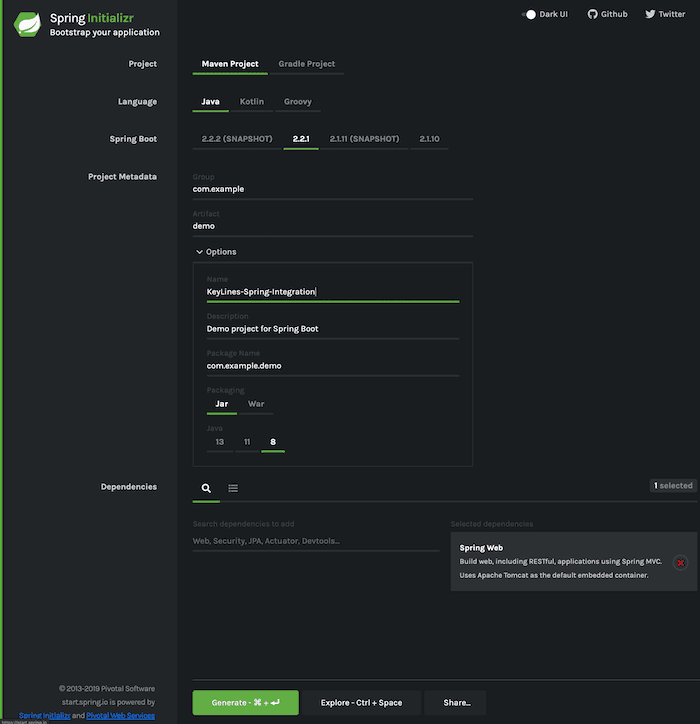
The quickest way to get started is using Spring Initializr to bootstrap your project. Its GUI makes creating projects really simple. We’ll also use Apache Maven to manage the libraries and Eclipse IDE.
We’ll select the Web dependency option for our KeyLines-Spring-Integration project and then generate it.

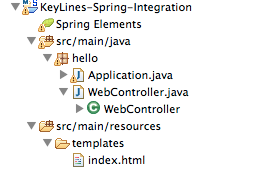
You should end up with most of your application code and a file structure that looks similar to this:

Now we’ve created the project, in the remaining steps we’ll add the WebController file and the index.html to the resources folder.
Step 2: Create the controller class
Next we’ll create a simple controller class to serve the HTML page:
package your.application.controller.package;
import org.springframework.stereotype.Controller;
import org.springframework.web.bind.annotation.RequestMapping;
import org.springframework.web.bind.annotation.RequestMethod;
import org.springframework.web.servlet.config.annotation.WebMvcConfigurerAdapter;
@Controller
public class WebController extends WebMvcConfigurerAdapter {
    @RequestMapping(value="/", method=RequestMethod.GET)
    public String showPage() {
        return "index";
    }
}
Step 3: Serve your web page
The Controller will serve the following index.html file containing the KeyLines component, which is in rc/main/resource/template.
<html>
  <head>
    <title>Spring and KeyLines together!</title>
    <meta http-equiv="Content-Type" content="text/html; charset=UTF-8" />
    <link rel="stylesheet" type="text/css" media="all" href="css/fonts.css" />
    <script type="text/javascript" src="js/keylines.js"></script>
    <script type="text/javascript" src="js/jquery.js"></script>
    <script type="text/javascript" src="js/data.js"></script>
  </head>
  <body>
    <h1> Spring and KeyLines together!</h1>
    <div id="kl" style="width: 650px; height: 400px;" ></div>
    <script type="text/javascript">
    var chart;

    $(window).load(function(){
      // let KeyLines decide which renderer fits better
      KeyLines.mode(‘auto’);

      KeyLines.paths({ assets: ‘/assets/’});

      // pass the callback to be called when the creation will be completed
      KeyLines.create(‘kl’, chartLoaded);
    });

    function chartLoaded(err, newChart){
      chart = newChart;

      // from here on you can use the KeyLines chart component. getData is a function in js/data.js file, but could also be a call to web server.
      chart.load(getData());
    }

    </script>
  </body>
</html>
Step 4: Run the application
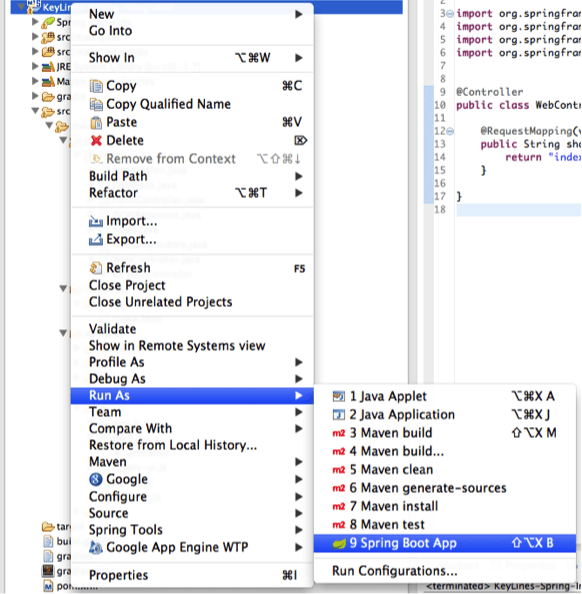
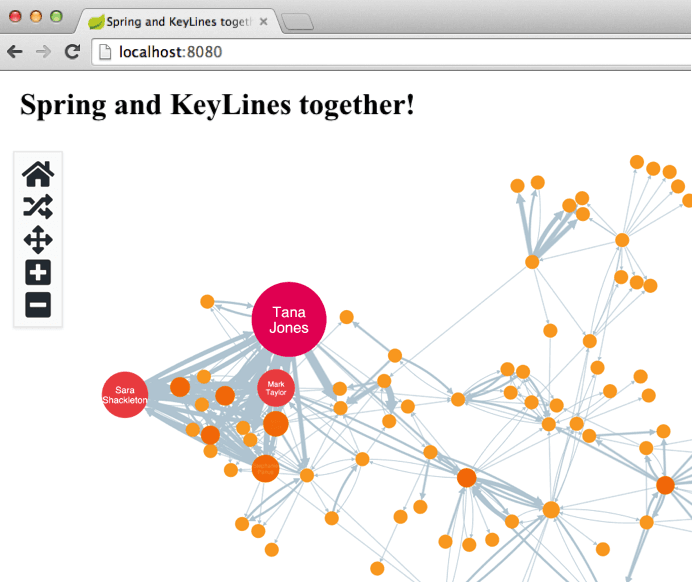
Finally, we’ll run the application from the IDE and point our browser to http://localhost:8080/:

And that’s it! We have a KeyLines data visualization in our Java application.

In four simple steps, we’ve got KeyLines running in a Java environment. The next stage is to decide which of the many powerful graph visualization features to use in your application.
Time to try KeyLines in your Java application?
This post demonstrates how easy it is to integrate our graph visualization technology and your Java application. If this doesn’t match your setup, get in touch and we’ll be happy to find the right solution for you.
If you want to evaluate KeyLines for free, go ahead and request a free trial.


