Creating effective visual models for big data graphs
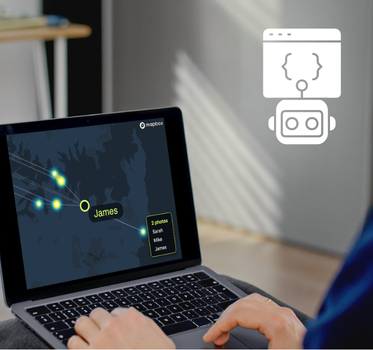
With big graphs, it’s important to put your data through the “data funnel”, a process of reduction from billions of data points to something a user can interact with and understand.
This webinar discusses the techniques you can use to do that.