Highlights
- KeyLines integrated into award-winning cyber security analytics solution
- Designed to visualize thousands of connected devices in real-time
- Cloud and on-premise deployments scaling from mid-size to very large enterprises
- CyberFlow saved five months of development time and costs using KeyLines

The ‘Internet of Things’ promises to transform how people and machines interact with the world around them. Cisco estimates that 50 billion devices will be connected to the Internet by 2020, allowing the remote operation and monitoring of systems, appliances and infrastructure.
With this comes an unprecedented risk. Many organizations lack adequate cyber security analytics systems required to protect even their existing networks. Adding devices increases the threat landscape and creates a new weakest link, vulnerable to exploitation from malicious hackers.
One KeyLines customer is leading the way in the Internet of Things cyber security race. CyberFlow Analytics is a San Diego-based cyber analytics company, founded in 2013. Their FlowScape system is an award-winning cyber security analytics platform, designed to empower analysts with 360-degree cyber situational awareness and meet the scale and complexity challenges of the Internet of things.
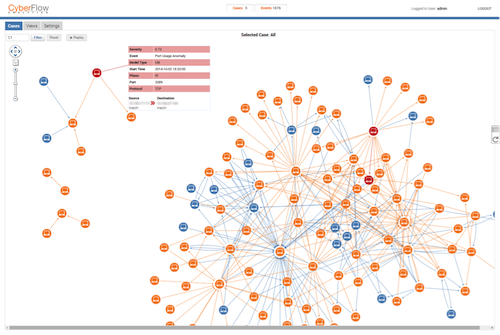
This case study explains how FlowScape incorporates powerful functionality from KeyLines to provide an intuitive and interactive GUI.
Cyber security analytics for IoT
FlowScape monitors disparate systems, feeding back real-time anomaly data – or ‘anomalytics’ – that may represent an on-going threat or breach.
Crucially, FlowScape is tuned to uncover ‘low and slow’ attacks – activity designed to go under the radar of perimeter-based systems – in real-time, running 24 hours a day.
For this to work, the experts at CyberFlow Analytics knew that they would need a rich and effective GUI. The FlowScape analytics-driven threat detection platform would have limited value without an effective way to communicate the output. As Ron Lifton, Head of Product Management at CyberFlow Analytics put it:
“The vision for FlowScape had two vital components from the outset: powerful behavior analytics and an impeccable visual front-end. Only then would network or security operations personnel benefit from pinpointing unusual behavior with complete clarity from day one.”
Building a cyber security analytics platform
With visualization forming core functionality of the application, finding the right solution was essential.
- Performance: the volume of the data running through the FlowScape is immense. KeyLines can handle networks of thousands of nodes in a meaningful way, allowing client-side rendering, easy showing/hiding of nodes and efficient automated layouts.
- Scalability: FlowScape is designed to be rolled out to users either on-premise or on the cloud. KeyLines can be instantly deployed to unlimited end-users.
- Customization: CyberFlow Analytics required a white label visualization component that could be fully customized to suit their workflow and branding. KeyLines allows this level of customization.
Ron Lifton summarizes:
“Our FlowScape development team carried out extensive evaluation of the available solutions – including other commercial products and building our own visualization component in house with open source tools. KeyLines was a clear winner. It offers excellent performance, a good commercial package and fits neatly into our overall solution architecture.”
By July 2013, CyberFlow Analytics had assembled their team of data scientists, security architects, software engineers and GUI developers. Working in two-week sprints, the team initially focused on building the solution architecture and behavior analytics models, evaluating various visualization options alongside this process.
By December 2013, CyberFlow Analytics had selected KeyLines as their visualization option of choice and started work building their cyber security analytics GUI.
With the help of the extensive documentation and code samples in the KeyLines SDK, the CyberFlow Analytics team was able to build and integrate their whole GUI in just three months.
Our experience of working with KeyLines and Cambridge Intelligence was excellent. They were responsive, knowledgeable and helpful at every stage of development. We occasionally offshore some tasks and had to triangulate meetings across multiple time zones, but that never seemed to be a problem.
I would estimate we saved roughly five months of development time and costs, compared with building our own application in-house. For a start-up, time to market is very important, both for selling the product and raising capital.”
The Result
Feedback on the FlowScape system has been excellent. In December 2014, the CyberFlow Analytics team were awarded the Connect Most Innovative Product award for Aerospace / Security Technologies.
By incorporating a well-designed, efficient network visualization component built with KeyLines, CyberFlow Analytics is able to show users what is happening in their networks, as it takes place. The ability to locate the ‘needle in a haystack’ with cyber security analytics from day one is a huge advantage to organizations that need to protect their network and systems.
For more information about CyberFlow, visit: www.webroot.com


