Supply chain visualization white paper
Visualizing supply chains for network & timeline analysisIn this ultimate guide to supply chain visualization, find out why the most successful supply chain models have visual network and timeline analysis at their core.
Trusted by 250+ organizations worldwide
Who is this guide for?
This guide is aimed at anyone who wants to optimize their supply chain, whatever industry the work in. It’s especially useful for supply chain managers or engineers, resilience managers, business analysts and product managers at original equipment manufacturers.
If you’re responsible for managing an efficient, responsive supply chain, you’ll discover why data visualization belongs on your roadmap.
What does the Cyber Security white paper include?
- Introduction to network and timeline visual analysis
- Overview of the 6 main supply chain models and their priorities
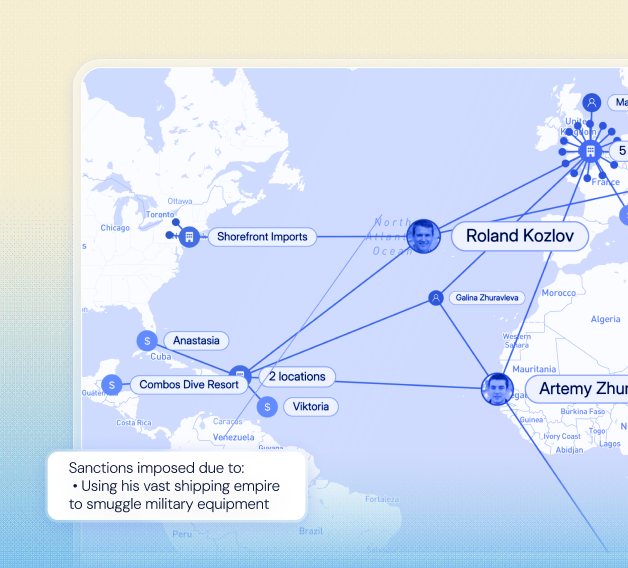
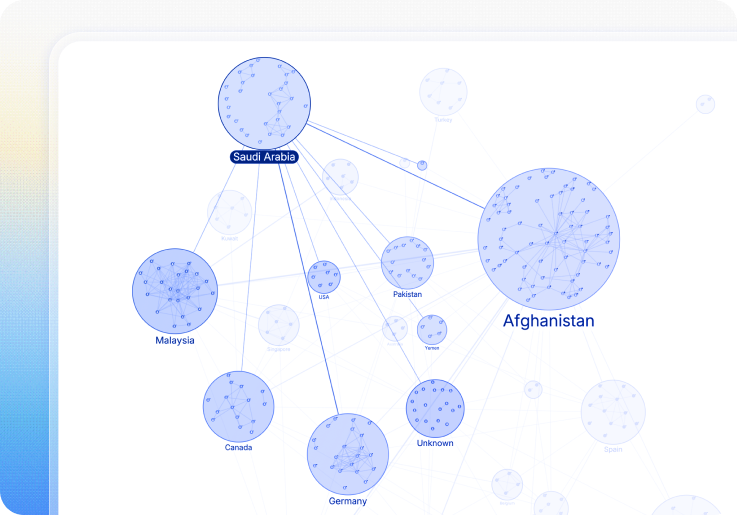
- Examples of how supply chain data visualization helps to: consolidate multiple data sources, identify key activities faster, manage risk, predict future behaviors, comply with regulations, improve transparency across your business
- Detailed supply chain visualization use cases: how to find the root cause of contamination in an agricultural supply chain, how to overcome current supply chain challenges in the automotive industry
- About our data visualization toolkits
Hundreds of teams rely on our toolkits and cutting-edge innovation to power complex data user experiences in their products and applications.
"There is a growing market for visual tools that make big data accessible and simplify complexity. Cambridge Intelligence has the best technology to do that. Our partnership means we can consistently deliver outstanding software and expertise, keeping our customers happy and creating innovative solutions to their challenges."
Trusted by 250+ organizations worldwide
Ready to visualize your connected data?
Bring clarity, confidence and interactive intelligence to your product – with visualizations that transform how users understand and explore complex data.