Solutions

Government data visualization

Helps analysts and decision-makers uncover relationships, understand evolving situations and coordinate operations with confidence.

The government and defense data challenge

Government and defense organizations operate in some of the most complex systems in the world, such as interdependent critical infrastructure networks, maritime domain awareness or border security.

These systems generate huge volumes of interconnected data that are difficult to understand using traditional dashboards or reports.

Analysts and decision-makers must be able to:

  • Uncover relationships across organizations, assets and events
  • Monitor evolving situations in real time
  • Coordinate complex operations across multiple teams
  • Communicate insight clearly to leadership and operational staff

Interactive graph, timeline and geospatial visualization help governments make sense of complex national systems and respond to emerging challenges faster.

Use cases

Governments use visual analysis to understand complex systems, monitor activity and support critical decision-making across defense, infrastructure and national security operations.

Defense and intelligence analysis

Understand relationships between organizations, events and assets across time, space and connections to support strategic, operational and tactical decision-making.

Maritime domain awareness

Track vessels, shipping networks and maritime activity to identify risks, enforce sanctions or perform beneficial ownership network investigation.

Critical infrastructure planning and monitoring

Visualise, plan changes to, and monitor the performance and security of interconnected infrastructure networks such as energy, transport and communications systems.

Government and defense logistics

Visualize and conduct impact analysis across complex supply chains supporting defence, humanitarian operations and national infrastructure.

Build applications that solve pressing government issues

Our visualization SDKs enable developers to build applications that integrate network, timeline and geospatial analysis into mission-critical platforms.

Team discussing confidential, government related topics

Government demos

Try these interactive demos in your browser.

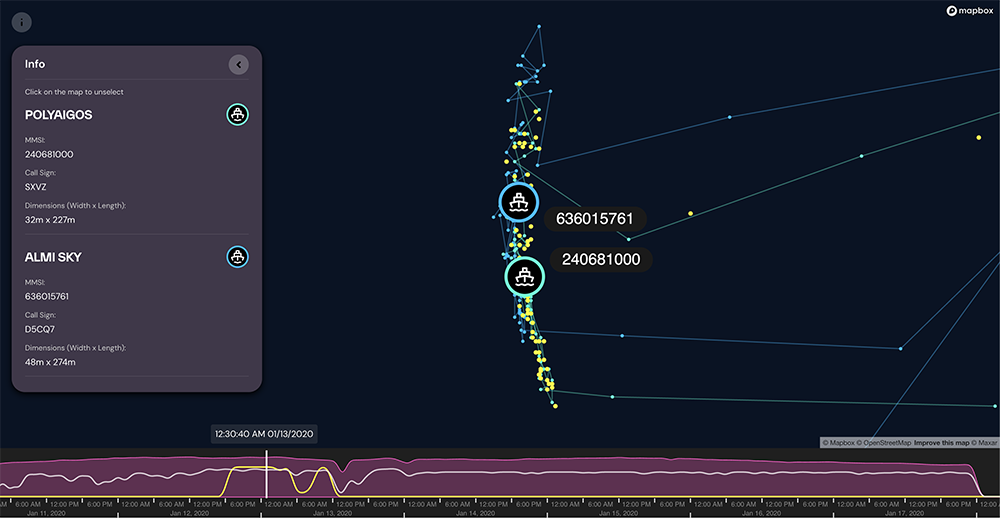
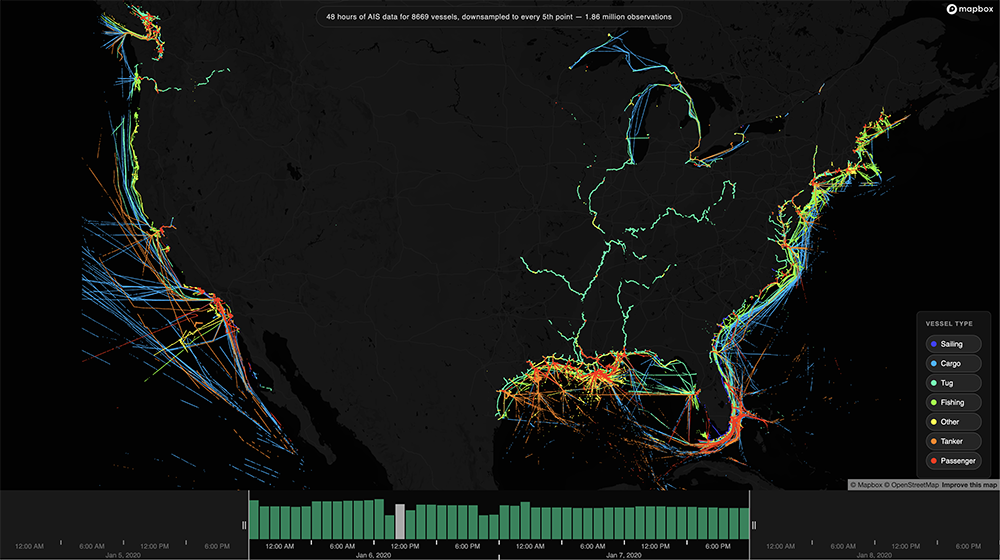
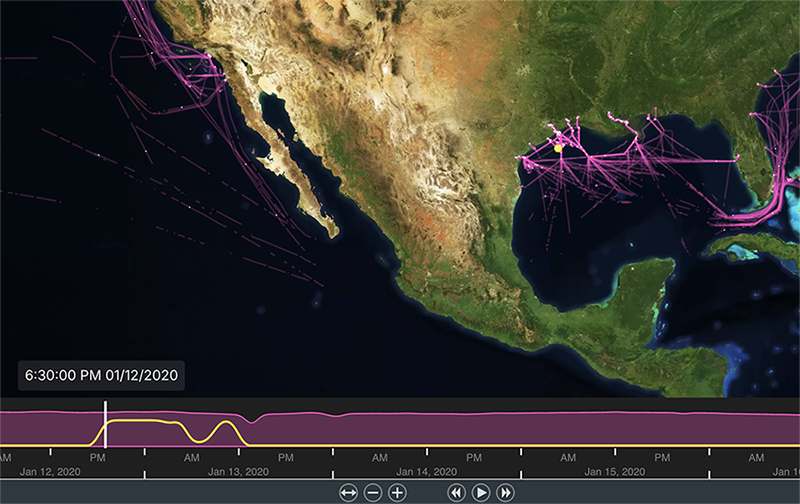
Maritime Intelligence

Explore 242,000 AIS observation points from a week’s worth of marine traffic around the US.
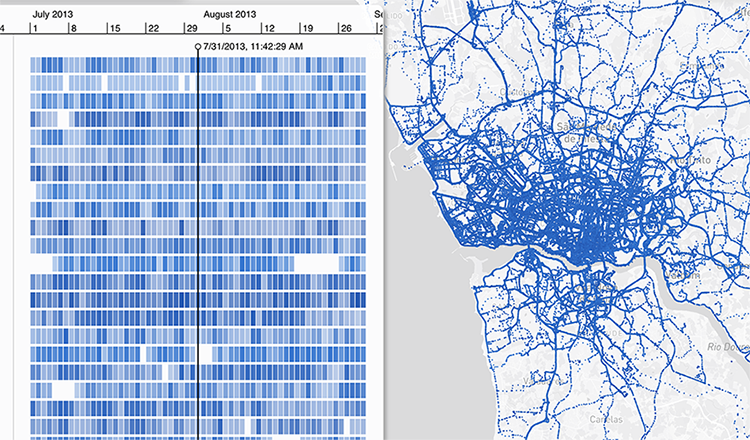
Pattern of life

Explore approximately 1 million observations of taxi locations in the Porto area of Portugal.
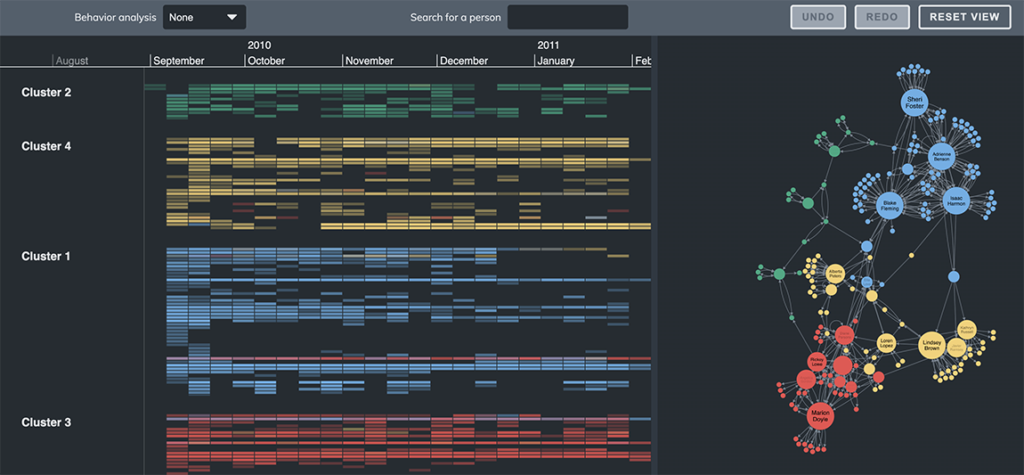
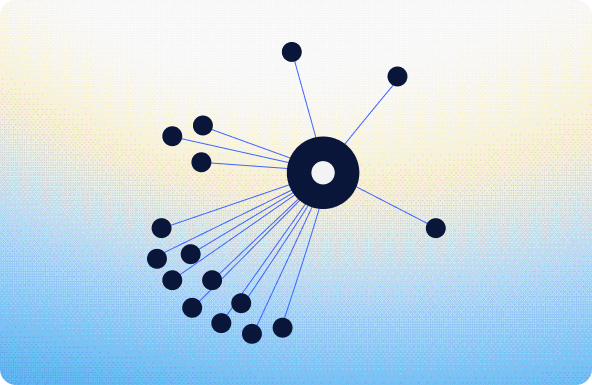
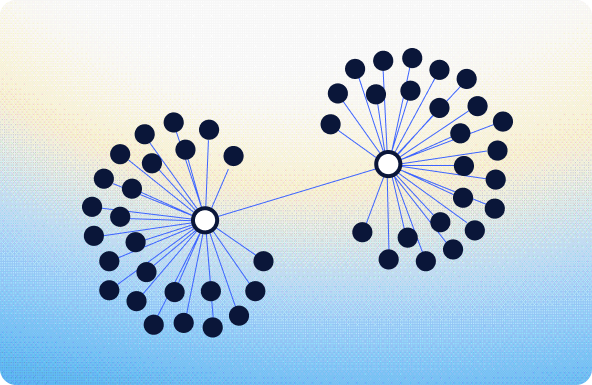
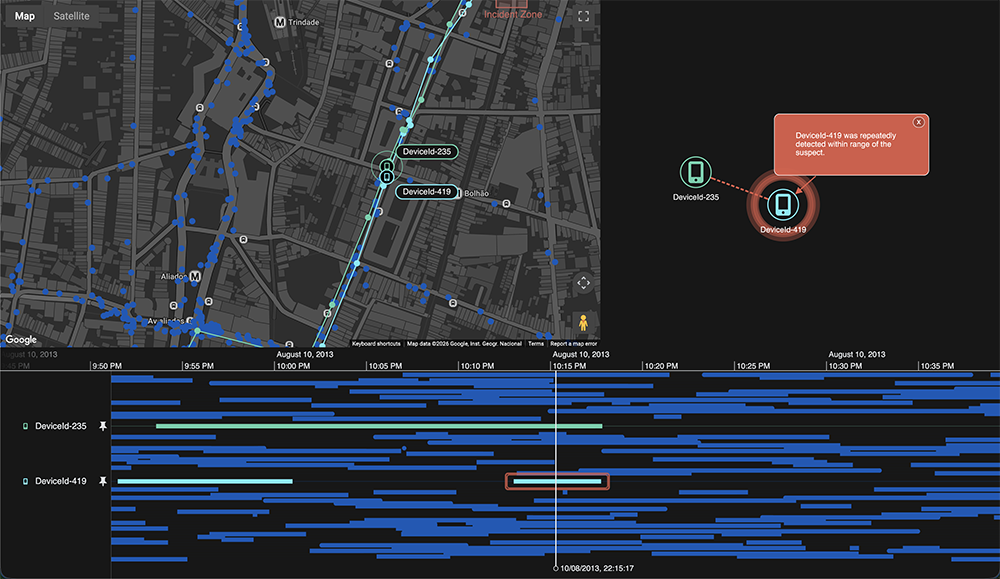
Phone Call Analysis

Investigate the precise sequence of events that contribute to a relationship between two entities, such as calls made between two people.

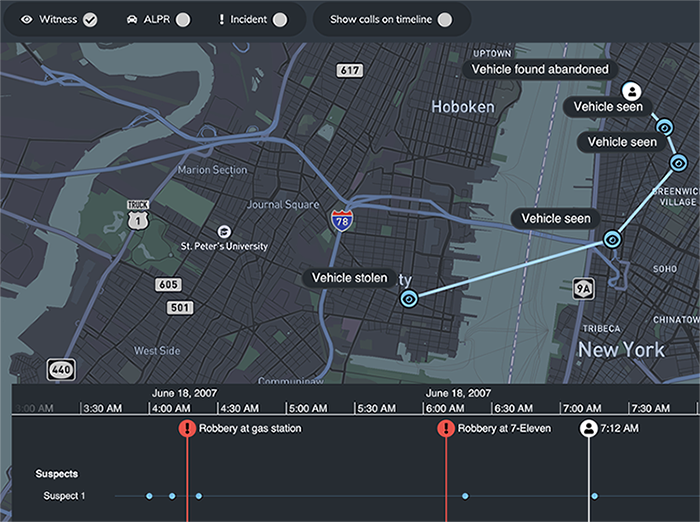
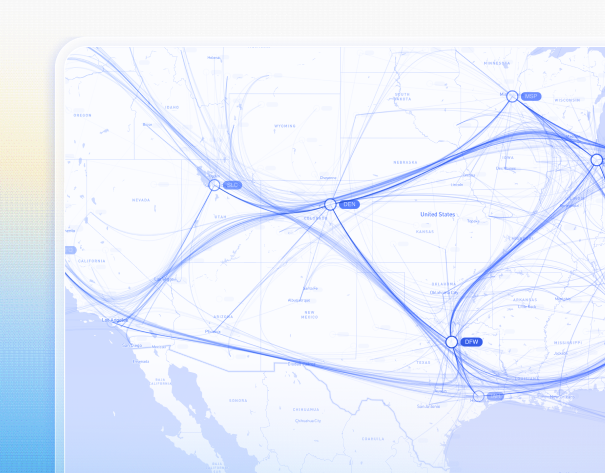
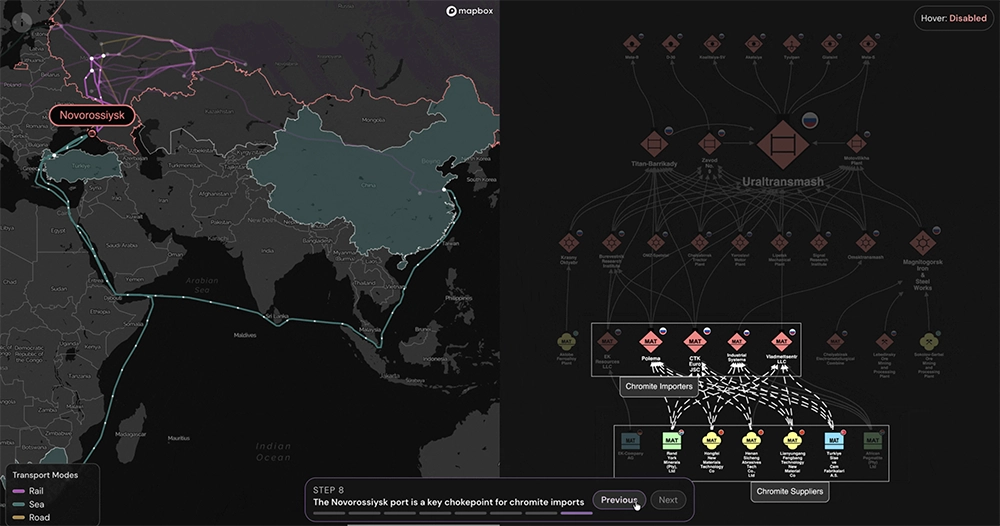
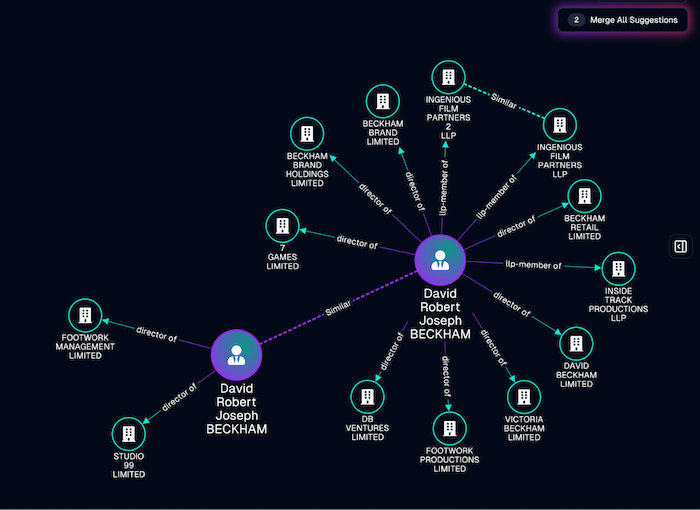
Geospatial investigations

Toggle different data sources using the legend, and zoom into the timeline to see the map update to reflect the time range in question.

See more use cases

Security and intelligence

Security and Intelligence

Risk and compliance

Risk and compliance

IT Management

Frequently asked questions

How is visualization used in government and public sector operations?

It helps teams understand complex data across people, events and locations to support analysis, planning and decision-making.

How does this support investigation, planning and situational awareness?

By connecting data across multiple dimensions, it enables users to build a complete picture of events and respond more effectively.

Can this integrate with existing government systems and data sources?

Yes, our SDKs are designed to integrate with a wide range of systems, databases and secure environments.

Is this suitable for mission-critical environments?

Our technology is deployed in high-security, mission-critical government and national security systems.