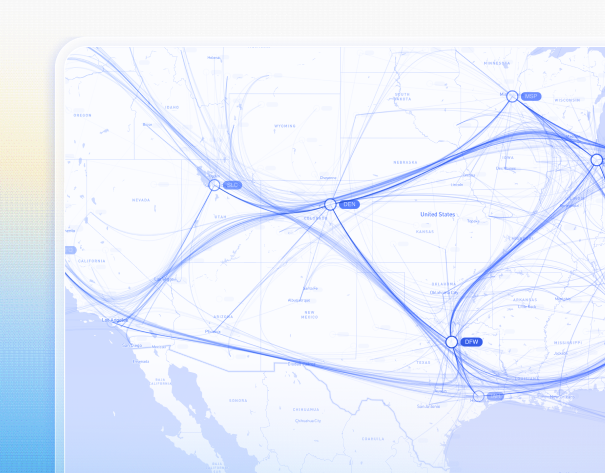


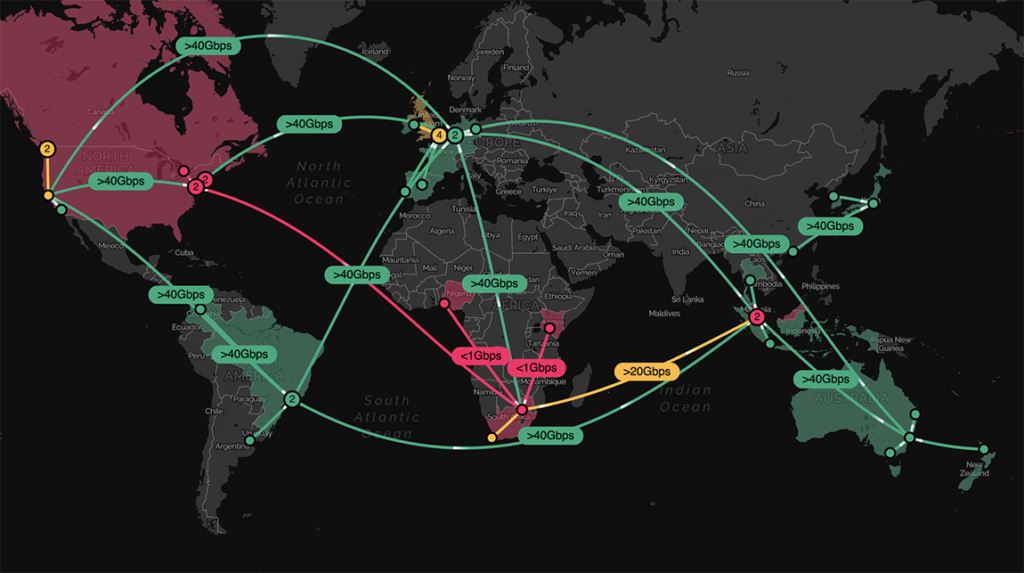
Network management
Dive into a geospatial overview of the health of a highly distributed IT or telecoms network.
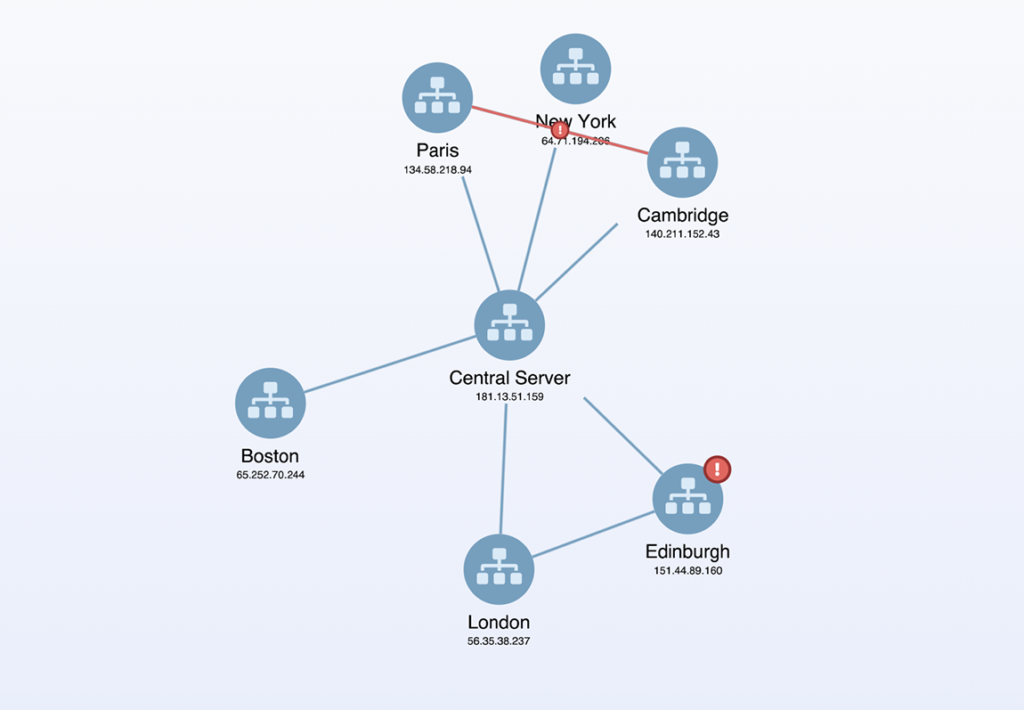
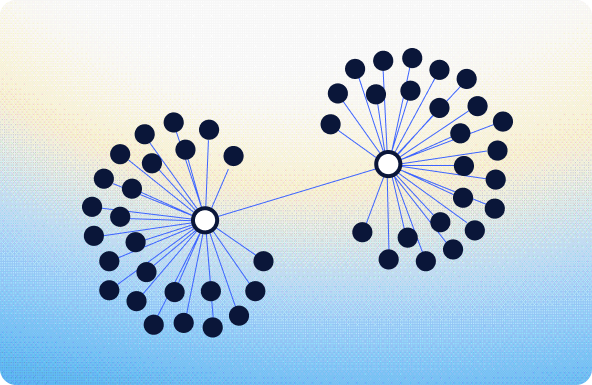
Network alerts
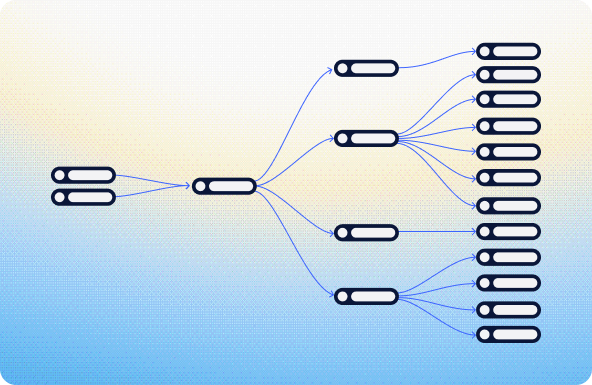
Examine an IT network that displays a number of offices at different locations and subnets within them, all speaking to a central server through which common services are accessed.
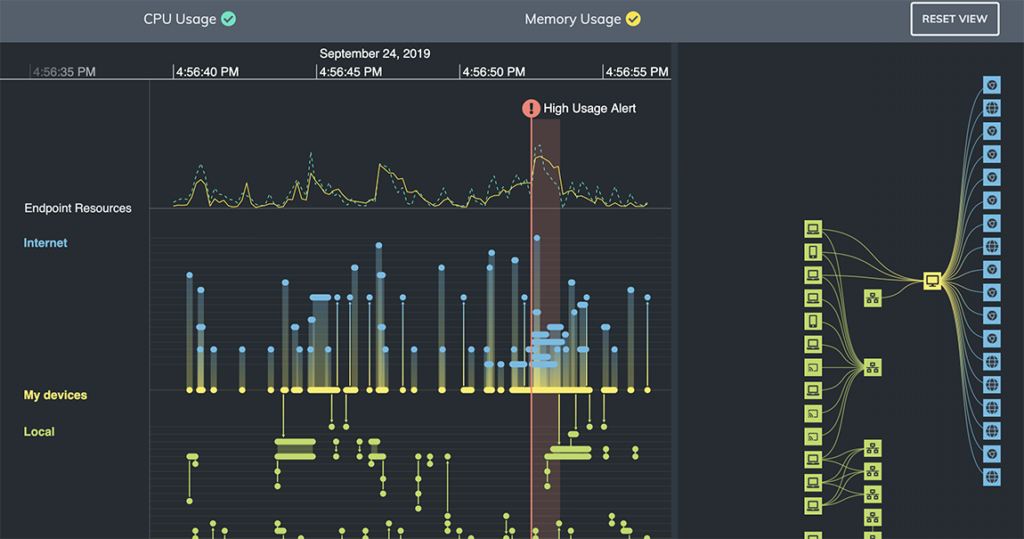
Network traffic analysis
Spot unusual patterns in log files by viewing timestamped logs in a timeline visualization.