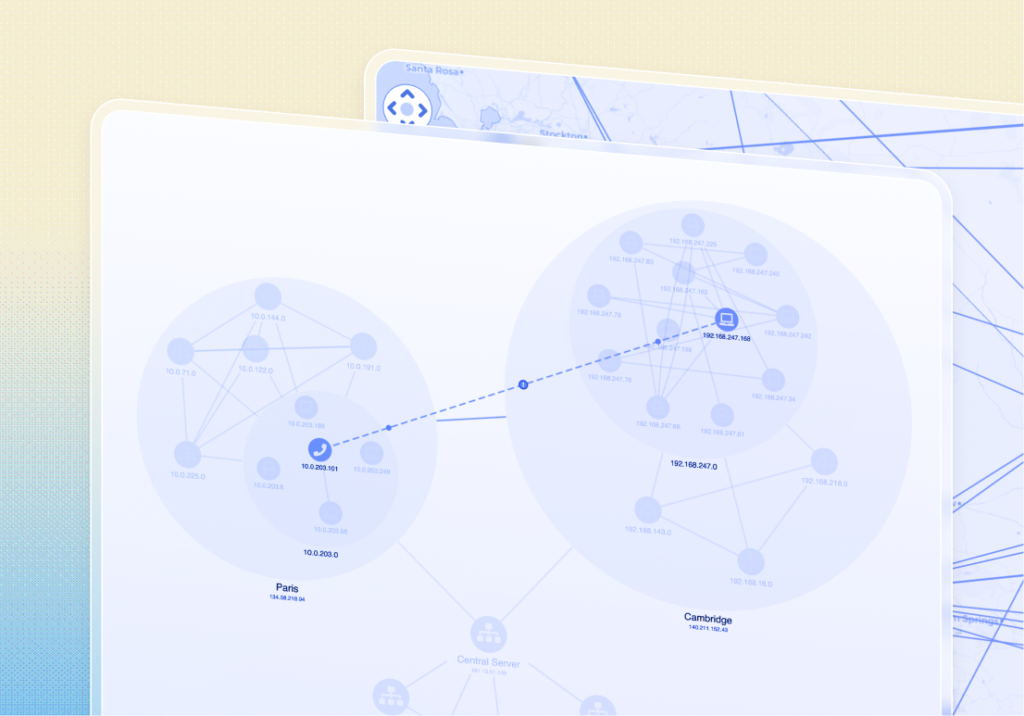
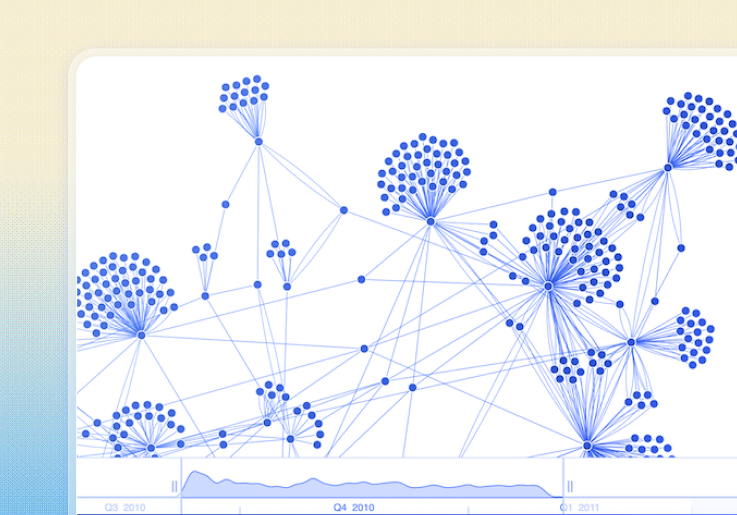
Developer Hub

Build powerful graph, timeline and geospatial visualizations with developer-first SDKs.

Trusted by developers who need reliability from day one.

Developers building graph, timeline, or geospatial visualizations often face the same problem: prototypes work, but production breaks at scale.

Our SDKs provide production-ready foundations, so you can focus on your application logic instead of fighting rendering limits, interaction complexity, or fragile open-source stacks. You get fine-grained control, reliable performance, and visualizations that scale with real-world data.

Find your SDK

Choose the toolkit you need. Each SDK includes comprehensive docs, live showcases, and an interactive playground to help you evaluate and build quickly.

KeyLines

KeyLines

The JavaScript SDK for graph visualization
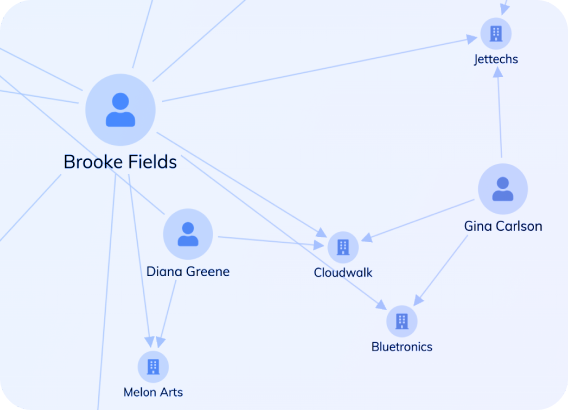
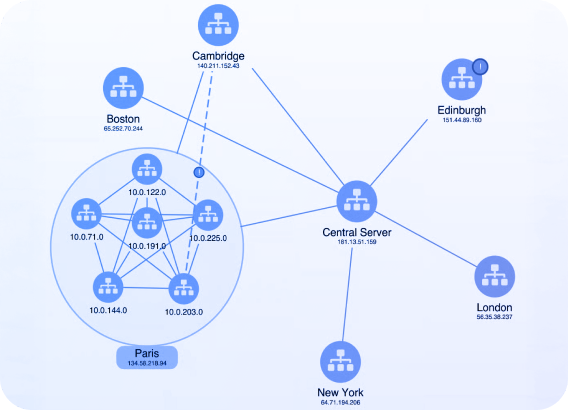
ReGraph

ReGraph

The React SDK for state-driven graph visualization
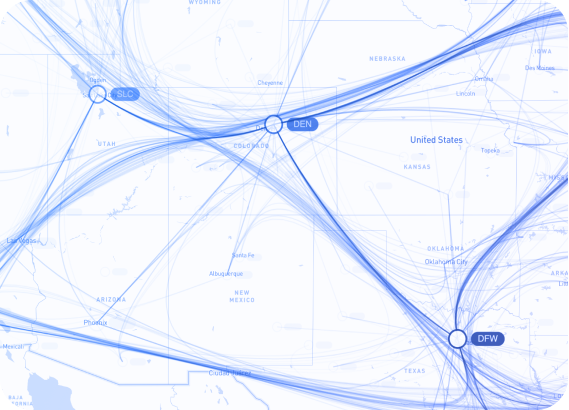
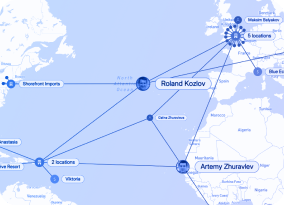
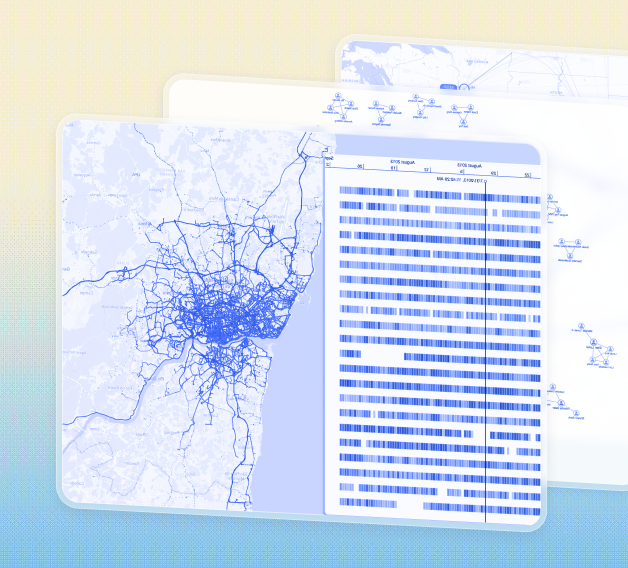
MapWeave

MapWeave

The geospatial visualization SDK for uncovering hidden connections
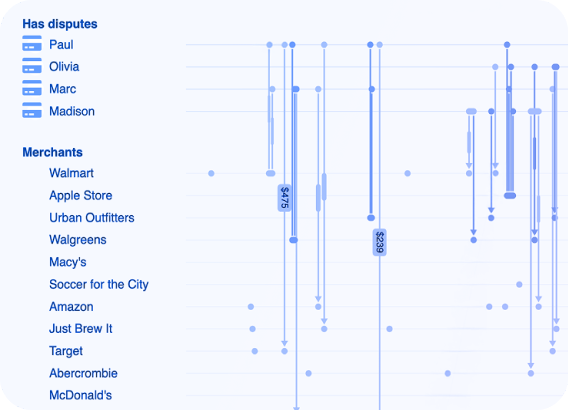
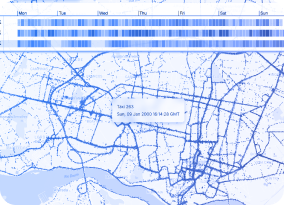
KronoGraph timeline visualization

KronoGraph

The timeline visualization SDK for investigating event data at scale

Integrations

Our SDKs integrate with your existing data sources and infrastructure, without pairing your visualization to a specific database or backend.

Neo4j logo

Neo4j

Kick-start your graph and timeline visualization projects with the world’s most popular – and arguably most user-friendly – graph database

Amazon Neptune

Amazon Neptune

Enjoy the performance, reliability and availability of Amazon Neptune – a serverless graph database hosted by Amazon Web Services

Cosmos DB

Cosmos DB

Build cloud-native graph visualization apps with Microsoft’s fully managed, distributed NoSQL and relational database – Cosmos DB

Tailwind

Tailwind

Integrate with Tailwind CSS, a utility-first CSS framework for creating highly-customized user interfaces.

Why developers choose our SDKs

Fast to market

Ship production-ready visualization features without weeks of groundwork. Our SDKs provide layouts, interactions and rendering logic out of the box, so teams can move from concept to live software quickly, without building and rebuilding a custom visualization layer.

scale icon

Proven to perform

Our toolkits are designed to handle large, complex, and fast-changing datasets without degrading performance or stability, even when combining graph, geospatial and temporal views in the same application.

Loved by engineers

Our SDKs offer well-defined APIs, flexible configuration, and predictable behavior, giving developers control over how visualizations are built, debugged, and maintained. They integrate cleanly with existing tech stacks and are database agnostic.

What you can build

Teams use our SDKs to build a wide range of interactive visualizations including:

KeyLines

Network investigation workflows

timebar

Fraud detection dashboards

Geospatial visualization

Intelligence analysis tools

Credit card demo

Pattern of life analysis

developer support

Developer support

Get help when you need it – from documentation and troubleshooting guides to direct technical support for your SDK, from the engineers who built them.