Build powerful graph & timeline tools on Azure Cosmos DB
Visualizing Azure Cosmos DB
About our toolkits
Our toolkits – KeyLines, ReGraph, Mapweave and KronoGraph – are software development kits (SDKs) for graph and timeline visualization.
They make it easy to create powerful interactive visualization tools that bring your data to life. These tools can then be rolled into your existing workflows and products, helping your users to explore and understand their data.
Our SDKs are 100% database agnostic, but integrate seamlessly with Azure Cosmos DB. They also work with any browser, device or server, leaving you free to choose the stack that works best for you.
Give users the graph insights they need
Our developer toolkits make it quick and easy to build graph and timeline visualization apps with Microsoft Azure Cosmos DB.
They combine performance with a hassle-free developer experience, and provide a completely flexible way to create graph and timeline visualization UIs that work anywhere, on any device.
They also integrate seamlessly with Azure Cosmos DB, giving your users an intuitive and interactive way to visualize and explore the data they need to understand.
Building timeline and graph visualization tools for Azure Cosmos DB
Whatever your stack, we have an integration tutorial to get you started.
Learn how to create graph and timeline visualization applications that empower users to see, explore and understand the data in their Azure Cosmos DB.
Powered by
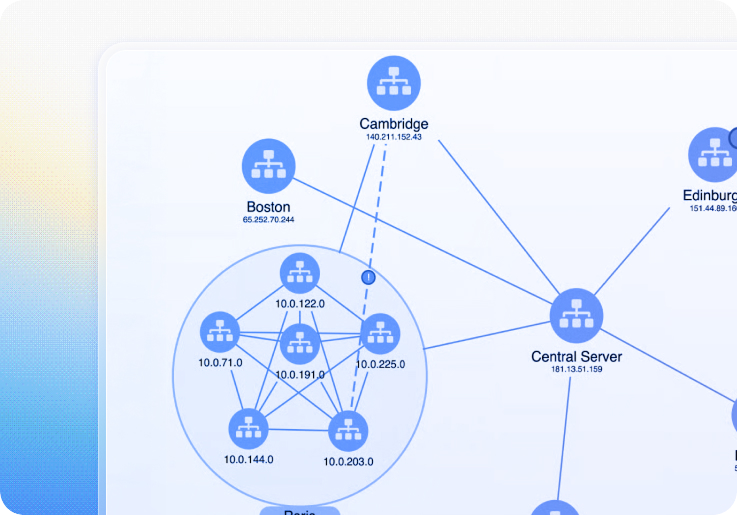
KeyLines
Graph visualization for JavaScript developers
Enjoy the flexibility to code how you like. Add graph visualization to your applications that work anywhere, as part of any stack.
Build for developers. Loved by teams.
Why do Azure Cosmos DB users choose our toolkits?
Fastest route
We design our toolkits with a fast developer experience in mind.
Equipped with our quick-start Neo4j demos, coding playgrounds, comprehensive docs and expert support, you’ll ship your Neo4j application in no time.
An easy integration
Whether you’re using Azure Cosmos DB for Apache Gremlin or one of the supported database APIs, our toolkits integrate seamlessly.
We also have a JavaScript and React-specific example to get you started.
Deliver the best UX
Our toolkits let you customize every aspect of your application – from branding to functionality.
The result is useful, insightful experiences your users value, and your competitors envy.
Powerful functionality
From timelines to centrality measures, automated layouts to geospatial maps.
Our SDKs have a huge range of visualization functions and analysis algorithms to uncover insight in your most complex datasets.
A trusted partner
We’ve been the leading provider of graph and timeline visualization technologies since 2011.
Hundreds of organizations worldwide rely on our toolkits – from pioneering startups to Fortune 500s and national governments.
Harness our innovation
We work year-round creating new features, ready to roll into your apps.
Keep customers happy and competitors on the back foot with constantly-improving, beautiful and unique visual analytics.
Ready to build your Azure Cosmos DB data visualization app?
Bring clarity, confidence and interactive intelligence to your product – with visualizations that transform how users understand and explore complex data.
Azure Cosmos DB Visualization FAQ
What is Azure Cosmos DB?
It’s Microsoft’s globally distributed, NoSQL and relational database for building high performance, planet-scale applications. Specifically optimized for scale, it delivers single-digit millisecond response times, automatic scalability and guaranteed speed. It’s also a fully managed database, so you don’t need to worry about patching, updates, back-ups or the other time-consuming database management tasks.
There’s a special Azure Cosmos DB for Apache Gremlin graph database service for running applications that work with densely connected datasets – sometimes called ‘graph data’. There’s also support for popular database APIs including NoSQL, MongoDB, PostreSQL, Cassandra and Table, so you can choose whichever ecosystem you prefer.
How do I visualize Azure Cosmos DB data?
You need a third-party visualization tool like KeyLines, ReGraph and KronoGraph
What is KeyLines?
KeyLines is our JavaScript software development toolkit (SDK) for graph visualization. It makes it quick and easy for JavaScript developers to build custom, powerful and interactive graph visualization tools. These can be rolled into your existing products and shipped to unlimited end-users.
What is ReGraph?
ReGraph is our React SDK for graph visualization. It offers the same performance, scalability and end-user functionality as KeyLines, but is specifically designed for React developers.
Every aspect of the SDK is optimized to feel as ‘React-native’ for the developer as possible, including fully-reactive components, state and data flow management and JSX-coded elements with clear syntax.
What is KronoGraph?
KronoGraph is our SDK for building interactive timeline applications. It comes with both plain JavaScript and React APIs.
The timelines built with KronoGraph reveal how events unfold over time, including heatmap views, individual event views, and intelligence data aggregation.
How do the visualization toolkits connect to Azure Cosmos DB?
The toolkits are front-end JavaScript components, so you choose how to connect them. Azure Cosmos DB for Apache Gremlin is the most commonly-used approach. If you’re using one of the other supported APIs, you just need to make sure that the data is converted into our custom JSON format.
Our tutorials demonstrate some of these options, but let us know if your requirements aren’t covered.
What are the use cases for Azure Cosmos DB visualization apps?
Hundreds of organizations worldwide use our toolkits to make sense of complex connected data. Their industry sectors include: security and intelligence, risk and compliance, and cyber threat intelligence.
Where can I learn more?
If you’re not ready to get started yet, take a look at our blog. You’ll find useful information on all aspects of data visualization and best practice.
If you want to explore your options with other graph databases, please visit our visualizing graph databases page.