


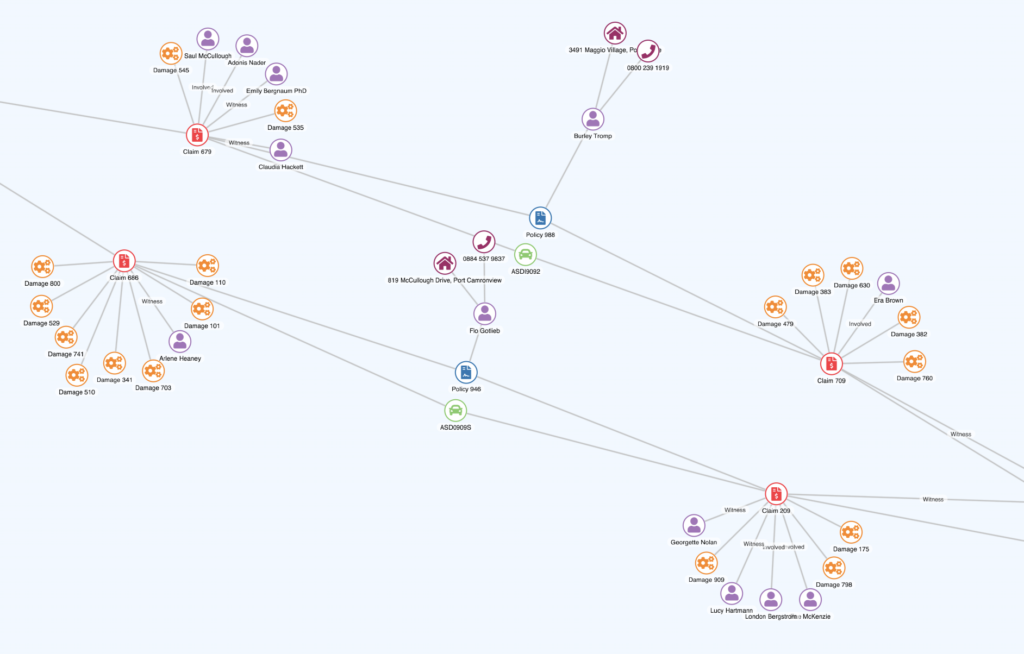
Insurance fraud analysis
Try different techniques for visualizing insurance fraud data to get a better understanding of what insights can be found.
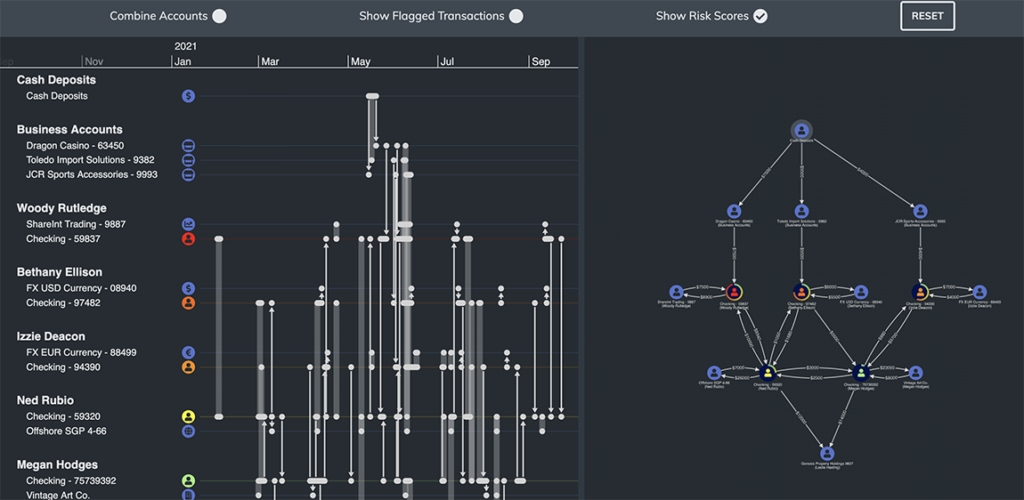
Anti-money laundering
Drill into transactions that have occurred within a suspected money laundering operation.
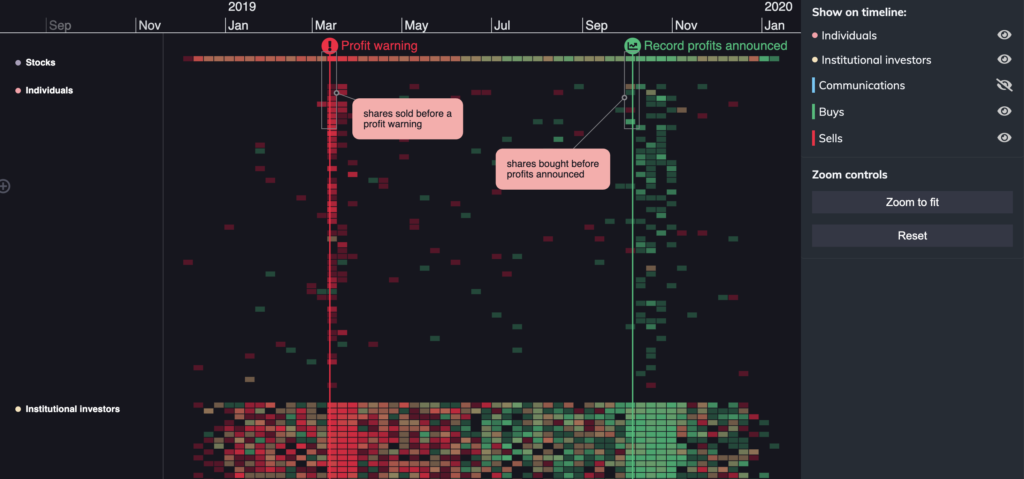
Insider trading
Zoom into share trades in a fictional company, MegaCorp.