Modern fraudsters don’t operate in isolation – they work across identities, devices, and geographies, exploiting blind spots in traditional siloed systems.
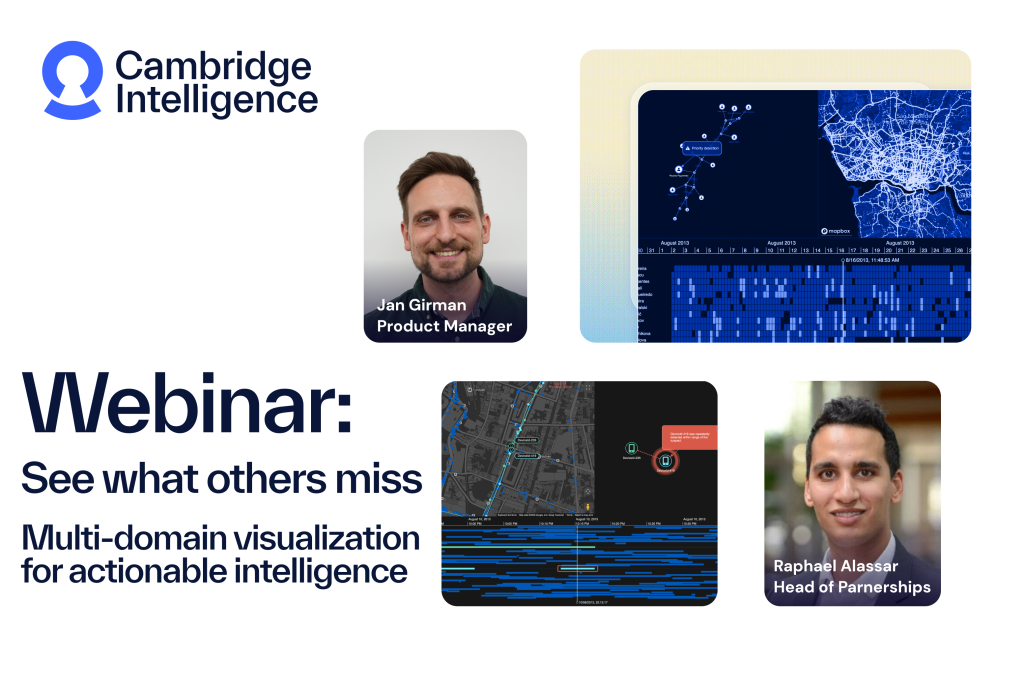
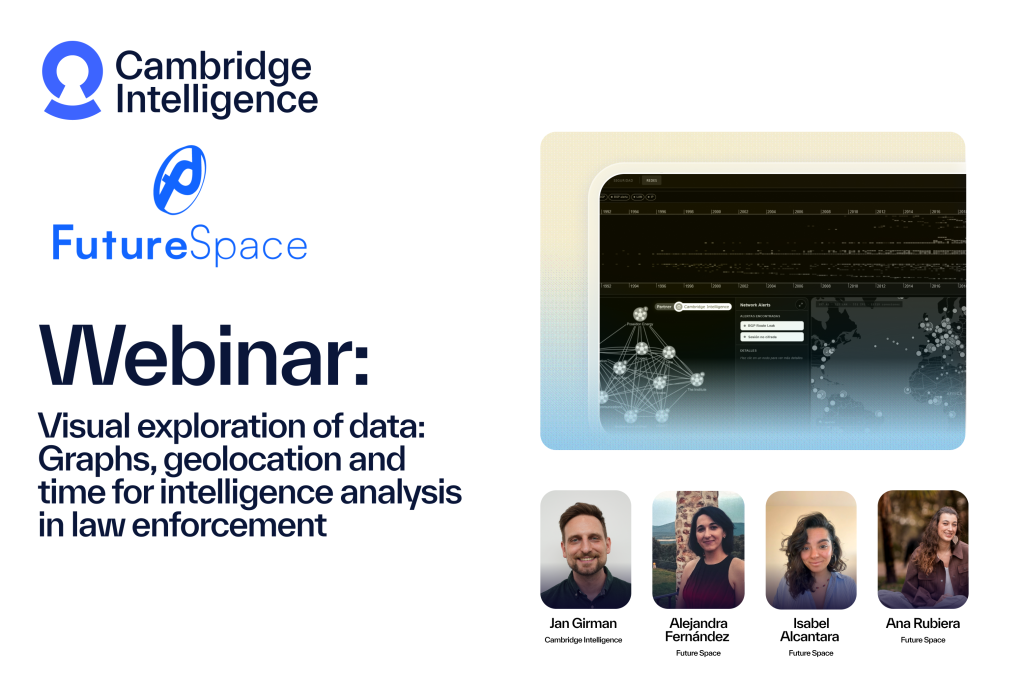
In this webinar, co-hosted with Progress MarkLogic, Paige and David show you how multi-model data management and visualization helps analysts to:
- Unify data intelligence into a single platform for real-time collaboration
- Uncover hidden fraud networks using advanced visualization techniques
- Accelerate investigations from weeks to hours
Explore our graph, timeline, geospatial visualization resources
Share: