Graph visualization white paper
The ultimate guide to graph visualizationEverything you need to start building effective graph visualizations that’ll help your users find insight in connected data fast.
Trusted by 250+ organizations worldwide
Who is this white paper for?
This white paper is for anyone interested in building graph visualizations.
What does the graph visualization white paper include?
- What is graph visualization?
- Why visualize graphs?
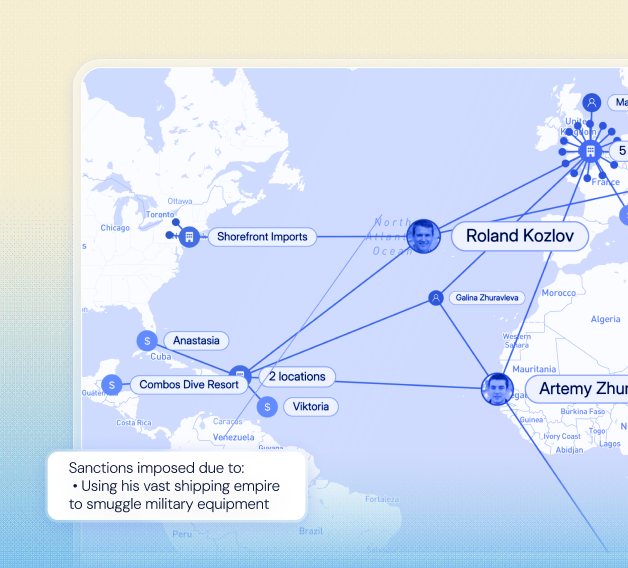
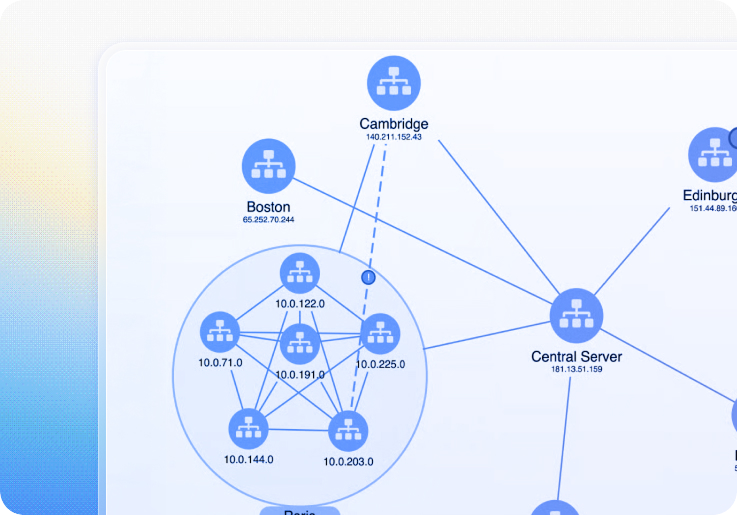
- Real-world use cases
- Can AI do all the work for us?
- Building the best visualization
- Choose the right tech for the job
- Do you need a graph database?
- Create the perfect model
- Adjust the signal-to-noise ratio
Hundreds of teams rely on our toolkits and cutting-edge innovation to power complex data user experiences in their products and applications.
"There is a growing market for visual tools that make big data accessible and simplify complexity. Cambridge Intelligence has the best technology to do that. Our partnership means we can consistently deliver outstanding software and expertise, keeping our customers happy and creating innovative solutions to their challenges."
Pierangelo Satriano, CTO of Sistemi & Automazione
Trusted by 250+ organizations worldwide
Ready to visualize your connected data?
Bring clarity, confidence and interactive intelligence to your product – with visualizations that transform how users understand and explore complex data.