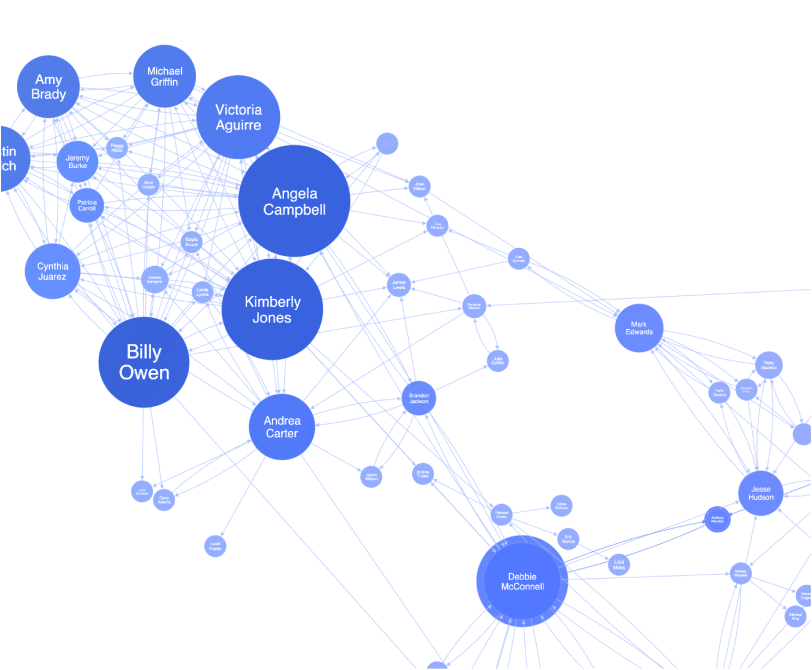
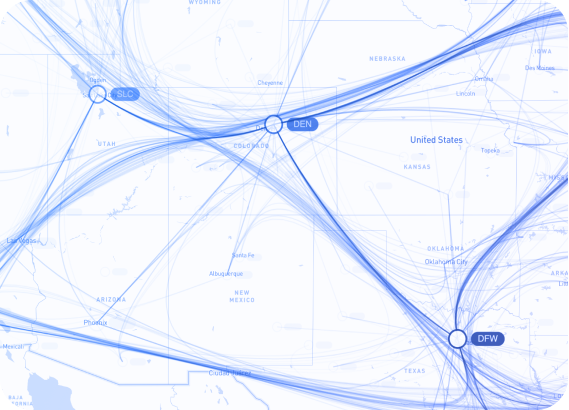
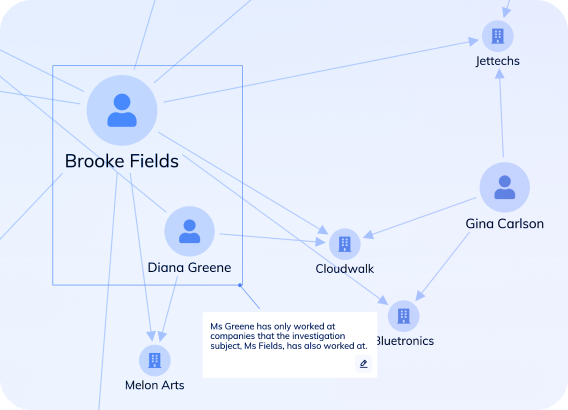
Visualizing Graph Databases

Visualize the connections in your data with our graph database visualization toolkits

Why use a graph database

Graph databases are often touted as the best option for storing connected data. Frequently cited reasons include:

Greater performance

Compared to NoSQL stores or relational databases. Graph databases avoid expensive ‘join’ operations and give faster access to connected data.

Lower latency

As the nodes and links in a graph database ‘point’ to one another, millions of related records can be traversed with a constant response time irrespective of database size.

Whiteboard friendliness

The graph format probably closely resembles your real-world data, meaning you can avoid complex data mapping and modeling exercises.

Good for semi-structured data 

Graph databases are schema-free, meaning patchy data, data with exceptional attributes, or data whose structure may change, can be more readily accommodated.

Why visualize your graph data?

KeyLines is a database agnostic graph visualization technology. It works with data from any source: graph database, NoSQL data stores, triple stores, and SQL databases or even just from memory. That said, graph databases are a particularly good fit for KeyLines:

Hierarchical graph icon

Convenient data structure

By storing data in a graph format, graph databases greatly simplify the data mapping and visualization modelling process. If you’re attempting to visualize data using a flat or tabular data source, you might find our blog post Graph data modelling 101 useful.

Speed

KeyLines is a fast and powerful graph visualization engine. Pairing it with a graph database – which is optimized for deep, complex graph querying – amplifies that performance. With an interactive KeyLines interface, users can ‘walk the graph’, exploring graphs quickly and effectively.

Deeper insight

Graph data is inherently visual. Giving users a visual way to interact with graph data leads to deeper understanding and faster decisions. Graph visualization techniques provide powerful tools to uncover patterns and detangle critical insight.

Who needs to visualize graphs?

Connected data is all around us. We help organizations solve their biggest challenges.

Annotations

Law enforcement

Join the dots between people, places and events and filter out the noise that stops you seeing the connections and preventing crime.

Timebar

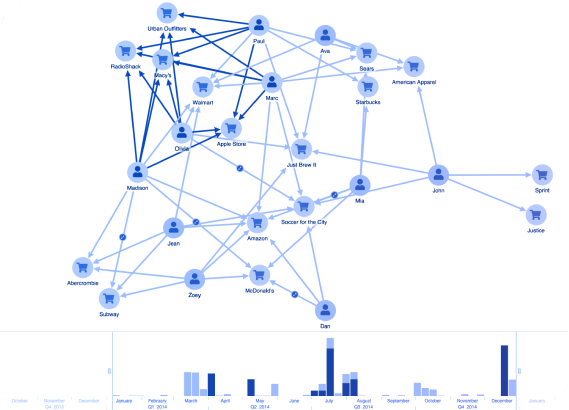
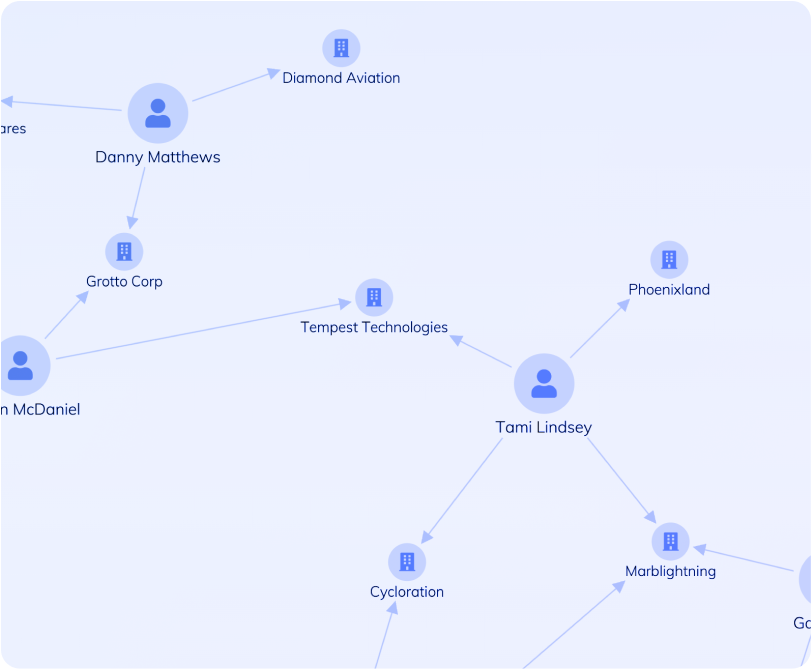
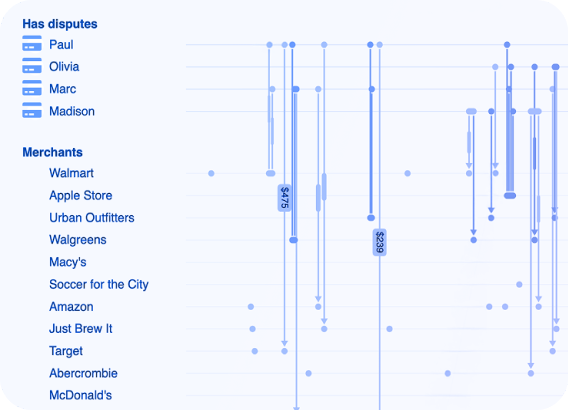
Fraud detection and anti-fraud

Uncover unusual activities to identify, predict and prevent all kinds of fraud: from insurance scams to VAT fraud.

Cyber security

Make sense of vast, complex and densely-connected data to uncover cyber security threats and help keep networks secure.

Infrastructure management

Create interactive visualizations that reveal bottlenecks and vulnerabilities in connected critical infrastructure.

How to visualize your graph data

At Cambridge Intelligence, we help developers build link analysis tools that are 100% customized to their users, their data and the questions they need to answer.


KeyLines

KeyLines

The JavaScript SDK for graph visualization

ReGraph

The React SDK for state-driven graph visualization

MapWeave

MapWeave

The geospatial visualization SDK for uncovering hidden connections

KronoGraph timeline visualization

KronoGraph

The timeline visualization SDK for investigating event data at scale