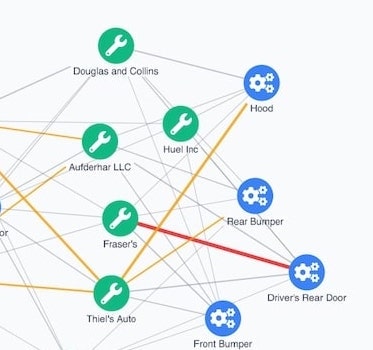
Visualizing DSE Graph
Getting started with KeyLines & DSE Graph
Start a KeyLines trial
To follow this tutorial, you’ll need access to KeyLines.
Visualization architecture
KeyLines is a database agnostic visualization solution that integrates particularly well with graph databases like DSE Graph.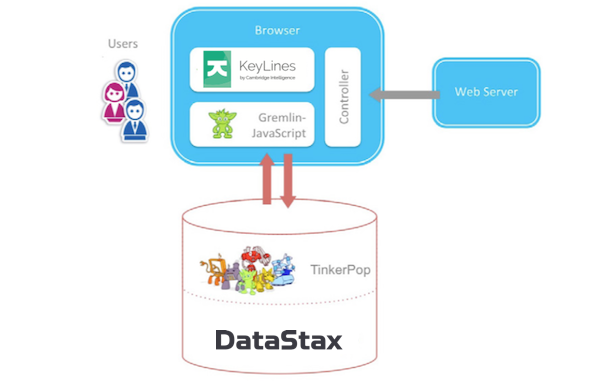
Integrate DSE Graph & KeyLines
This tutorial walks you through the steps to connect KeyLines to your DSE Graph database. If you’re not using KeyLines already, sign up for a free trial. You’ll also get access to the KeyLines SDK site featuring demos and a live-coding playground.Step 1: Configure the DSE Graph & load data
For full configuration and loading details, see the DataStax documentation.Step 2: Connect to the Gremlin Server
By default, the Gremlin Server uses the WebSocket channel. This makes it ideal for real-time or data streaming scenarios, but as it has a custom sub-protocol, it is unlikely to work in its default state. Drivers already exist for many different languages. There’s a client library for JavaScript and NodeJS called gremlin-javascript. It uses ES2015/ES6 features including JavaScript Promises for better flow control, and template strings for easier-to-read Gremlin query generation. To use the gremlin-javascript library in your browser, follow their instructions, and then include the resulting gremlin.js file in the HTML page. In the app file, create and configure the client: let client = null;
const connectClient = () => {
// create a gremlin client
client = new gremlin.driver.Client(configs.endpoint, {
traversalSource: 'movies.g',
mimeType: 'application/vnd.gremlin-v2.0+json',
});
}
connectClient();
Next, submit the query:
          async function submitQuery(client, statement, bindings) {
          // if client still doesn't exist, reject immidiatly with the last error
          return new Promise((resolve, reject) => {
            if (client === null) {
              reject(error);
            } else {
              // resolve the promise if submit is successful, set a new error otherwise
              client.submit(statement, bindings)
              .then(resolve)
            }
          });
        }

        async function returnResponse(client) {
          const response = await submitQuery(client, 'g.V().hasLabel("Movie").has("title", querySearch).inE("ACTED_IN").outV().hasLabel("Person").project("degree").by(outE("ACTED_IN").count()).path().unfold()', { "querySearch": "The Matrix" });
          return response;
        }

        const items = await returnResponse(client);

        // turn the response into KeyLines

        const keyLinesItems = toKeyLinesFormat(items._items);
Step 3: Convert to KeyLines JSON
To display our graph, KeyLines needs the data in its own JSON format. Let’s write a toKeyLinesFormat function to create a JSON object of nodes and links that KeyLines can recognize: function toKeyLinesFormat(rawItems) {
const items = [];
while (rawItems.length) {
// the response format is subject to the sent query format
const [v1, edge, v2, degree] = rawItems.splice(0, 4);
items.push(makeNode(v1), makeLink(edge), makeNode(v2, degree.degree));
}
return items;
}
Step 4: Load the graph in KeyLines
The final step is to load the data in our KeyLines chart: chart.load({
type: 'LinkChart',
items,
});
And that’s it! You’ll see a KeyLines chart that can pull data from your DataStax DSE Graph database.
Next steps: Extend the UI
Every object type, function, event and option is documented in the KeyLines SDK’s API Reference library. Use this, together with the live-coding playground, to create customized tools that’ll help your users explore and understand the data in their own DataStax DSE Graph databases.Ready to get started with KeyLines?