Building with KeyLines
Build high performance graph visualization tools quickly
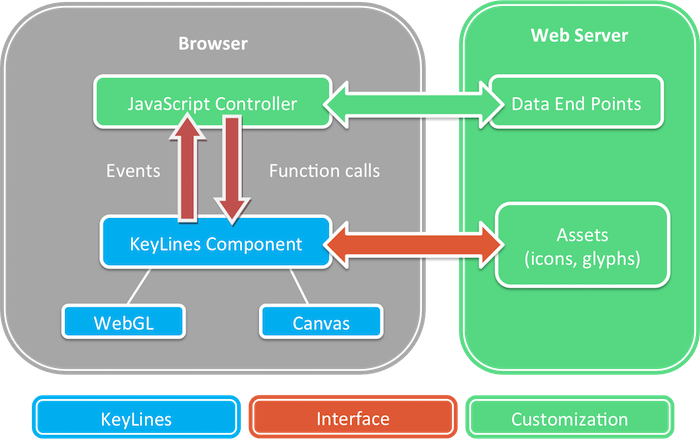
How does KeyLines work?

KeyLines is a JavaScript software development kit (SDK). You can use the technology to quickly build network visualization web components to embed in your applications.
These components use WebGL and HTML5 Canvas for fast performance, and harness a powerful event model and API of functionality to help make sense of data connections.
With detailed API documentation to help you, and a team of KeyLines developers providing support, it’s easy for you to build the custom visualization applications your users want.
Why Build with KeyLines?

Designed for performance
Every aspect of KeyLines is built for performance.
It uses fast, lightweight JavaScript, plus WebGL and HTML5 Canvas for powerful rendering across all browsers. Carefully optimized graph algorithms mean it can handle your biggest datasets.

Built for developers
We’ve designed KeyLines with a developer’s needs in mind.
The documentation is easy to follow and features example source code. If you need help, our developers provide expert support and guidance.

It works in your existing environment
We’ve worked hard to ensure KeyLines apps ‘just work’ in any setup.
You can keep your existing servers and code in your preferred JavaScript framework. We also have integration guides to help you connect to your favorite database.

A powerful API
KeyLines includes a fully-documented API of functionality including real-time, dynamic and geospatial network support.
We run to a frequent release cycle, with multiple releases each year, plus patches in between for enhancements and fixes.
Want to know more?
Use your favorite JavaScript framework
Quick start guides and detailed demos help you get KeyLines up and running with your favorite JavaScript framework.


Using React? Check out ReGraph
Lightweight and scalable
KeyLines is a front-end application that works seamlessly with any IT environment, so there’s no need to change your existing setup. You choose where to host it.
Fully agnostic, KeyLines works with virtually any data repository and your data never leaves your trusted network. For even stronger security between server and web browser, simply set up secure channel using SSL.
There’s no need for specialist visualization servers because KeyLines manages rendering at the front end. Even better: there are no compulsory external dependencies or plugins to install.
Any browser, any device
KeyLines works in all major browsers on desktops, tablets or cell phones.
Trusted by developers
KeyLines has been deployed into hundreds of high profile applications around the world.


KeyLines, a stable and flexible graphing framework, empowered us to focus on our product layer while offloading technical graphing complexities. Along with their great personal support, KeyLines is our go-to solution.
How the API works
Step 1: Download KeyLines
Follow our instructions to add KeyLines to your new or existing JavaScript project.
Step 2: Connect to your data source
KeyLines is database agnostic, so you choose whatever datastore you want.
Step 3: Customize chart actions
Demos and a fully-documented API make it easy to work with every object, function, event and option.
//     Copyright © 2011-2025 Cambridge Intelligence Limited.
//     All rights reserved
//     Sample Code - Exploring graph data in the time bar.

window.onload = async () => {
  KeyLines.promisify();
  const [chart, timebar] = await KeyLines.create([
    { container: 'kl', type: 'chart' },
    { container: 'tl', type: 'timebar' }
  ]);

  // load data into both the time bar and the chart
  timebar.load(data);
  timebar.zoom('fit');

  chart.load(data);
  chart.layout();

  // When the time bar range changes
  timebar.on('change', async () => {
    // filter the chart to show only items in the new range
    await chart.filter(timebar.inRange);
    // and then adjust the chart's layout
    chart.layout(‘organic’, {mode: ‘adaptive’});
  });
};
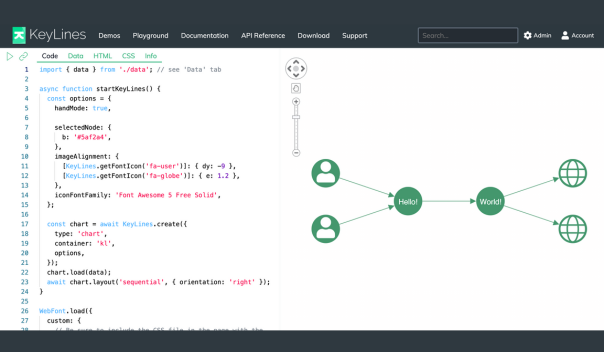
The KeyLines Playground
KeyLines comes with its own live-coding environment designed for rapid prototyping and sharing code more easily.
With the playground you can edit and create instant KeyLines graph visualizations within the KeyLines SDK site.
It makes collaboration much simpler too. Once you’re ready to show colleagues your ideas, just share the hyperlink.
Integrate with your favorite database
KeyLines is flexible enough to work with virtually any database. If your data can be parsed into a JSON format, KeyLines can visualize it.
To help you get started, we’ve built integrations with some of the most popular data storage and querying technologies.
Click a logo to find out more.


Want to try it for yourself?
From our blog
Our blog is full of useful materials and tutorials to help you make the most of the KeyLines SDK.