
In this blog post, we’ll run through the different Angular examples we’ve created for KeyLines, and show you how you can use it to create your own Angular graph visualization app.
Over the years we’ve worked closely with thousands of JavaScript developers. During that time, there has been a notable shift in the way code is written, with the rise of the JavaScript framework.
These frameworks have made writing good code easier, giving developers the freedom to build complex web applications without worrying about code structure or maintenance overhead. KeyLines is compatible with lots of different frameworks, and you’re free to choose whichever you prefer, but Angular is more popular than most so we’ve given it a little extra attention.
A clarification of naming…
Before we get started, we should explain how Angular’s versioning works.
The original Angular framework was AngularJS. This is sometimes called Angular 1, or Angular 1.x.
In September 2016, the Angular team released the next iteration of their framework. It’s simply known as Angular, or the Angular Component, but often informally called Angular 2. It is a complete re-write with fundamental and breaking changes throughout the framework.
For added confusion, the latest version of Angular is version 4.0. The team decided to skip v3 to align versioning among their own different packages. v4 is backwards compatible to v2.
KeyLines with Angular (v2.x)
The changes in this updated version of Angular were so dramatic that almost immediately after its launch we started getting requests for a new version of the AngularJS directive. Our latest release, KeyLines 3.4, included a new integration and two extra demos to kick-start your projects.
KeyLines 3.4 also added support for TypeScript – a typed superset of JavaScript that compiles to regular JavaScript – in which Angular is written. The combination of Angular and TypeScript is powerful, and getting started is easy.
Compared with AngularJS, the getting started process for Angular with KeyLines should be familiar. The biggest change here is caused by the removal of both $scope and ‘controllerAs’, which were demoted in favor of components in the latest iteration of the framework.
Step 1 – declare your component
<kl-components>
  <!-- chart -->
  <kl-component id='kl' klType='chart' (klReady)='klChartReady($event)'>
</kl-components>
Step 2 – Use the KeyLines API inside your component
Listen to the ‘klReady’ event in your component.
public chart: KeyLines.Chart;
klChartReady(chart: KeyLines.Chart) {
  this.chart = chart;
  // You are ready to use the API as you want!
}
Step 3 – Bind KeyLines events
In your template, use:
<kl-components>
  <!-- chart -->
  <kl-component id='kl' klType='chart' (klEvents)='klChartEvents($event)'>
</kl-components>
In your component, use:
// will receive events for the chart
klChartEvents(event: any) {
  if (event.name === 'hover') {
    console.log('Chart hover event triggered: ', event.args);
  }
}
KeyLines with AngularJS (v1.x)
We spent quite some time working with our customers on a KeyLines directive for the original AngularJS.
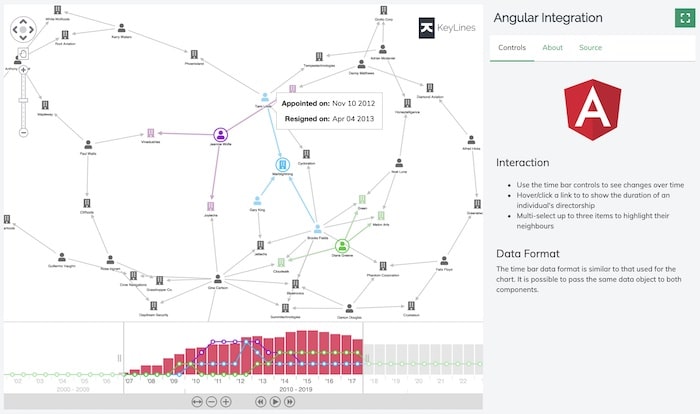
It’s compatible with all AngularJS versions from v1.3.x and later and is showcased in an interactive demo on the KeyLines SDK site. You can view the source code as a jumping-off point for your own projects:
There are three simple steps for getting started with our AngularJS directive.
Nb. You can use either $scope or ‘controllerAs’ syntax, and incorporate more than one component in a single page. For simplicity, our examples here use $scope and have just one component, but full examples can be found on the KeyLines SDK site. Request a free trial account here.
Step 1 – declare your component
<kl-component
  id='kl' style='width:744px; height:430px;'
  kl-type='chart'
  kl-ready='klReady'>
</kl-component>
Step 2 – use the KeyLines API inside your component
Add the KeyLines directive:
angular.module('myApp', ['ngKeylines']);
And listen to the ‘kl-ready’ event in your controller:
$scope.klReady = function (component) {
  $scope.chart = component;
  // You are ready to use the API as you want!
}
Step 3 – bind KeyLines events
In your HTML:
<kl-component
  id='kl' kl-type='chart'
  kl-hover='onHover'>
</kl-component>
In your controller:
$scope.onHover = function (evt) {
  console.log('Chart hover event triggered!');
}
And you’re good to go!
Use KeyLines to create an Angular graph visualization app
Our aim with both of these integrations is to make it easy for KeyLines developers to harness the advantages of the Angular framework and build better apps more efficiently.
As always, we’re keen to get your feedback on any aspect of the toolkit. Get in touch with your comments or suggestions.
Alternatively, if you’ve been inspired to try KeyLines for yourself, request a free trial account.
Share:
