FREE: Start your KeyLines trial today
Visualize your data! Request full access to our KeyLines SDK, demos and live-coding playground.
Vue.js is a popular JavaScript framework which is going head-to-head with the likes of Facebook’s React and Google’s Angular. We’ve certainly seen an uptick in requests for Vue integration with KeyLines, and we were delighted to be able to release our Vue component back in September.
Read on to discover how easily KeyLines can integrate with Vue to bring powerful graph visualization to your application.
Vue is an open source JavaScript framework for building user interfaces. It uses a component-based architecture that will be familiar to React and Angular users, but offers a lighter touch.
Vue comes with several powerful features – including a virtual dom, binding framework, templating engine, a router, server-side renderer and more. But it’s also very flexible and can be very lightweight, allowing you only to use the features you need for your application.
One of KeyLines’ strengths is how easily it integrates with other frameworks. Since it’s just a library, it’s simple Javascript API and comprehensive eventing system make it easy to plug into frameworks and applications. We already support React, AngularJS and Angular. And now it’s easy to bring KeyLines into Vue environments, too.
We’ve published a KeyLines-Vue component, which is really just a wrapper around the KeyLines API. Once this has been loaded into your application, you can work with KeyLines as a regular API or use Vue to bind chart data directly to forms.
It all starts with some data. KeyLines is agnostic as to what backend data comes from – maybe from a graph database or some pre-formatted JSON. In our demo, we’re going to use data from the Enron emails corpus dataset.
Whatever the source, KeyLines expects data in the following format:
{
  type: "LinkChart",
  items: [{
      // Definition of a node
      id: "tamara_black",
      type: "node",
      t: "Tamara Black", // The node’s text
      c: "#B2356D"       // The node’s colour
      d: { email: "[email protected]" } // custom node data
    }, {
      // Definition of a link
      id: "l1",
      id1: "tamara_black",
      id2: "maria_valdes"
  ]
}
We need to assemble and download this data outside of Vue: for now, we’ll just assume it’s available in a variable called chartData.
KeyLines provides a Component to simplify integration with Vue, making it easy to load the chart a with declarative rendering.
Once we’ve added Vue, Keylines and the Vue-KeyLines component into the page, here’s all we need to do to create our chart, bind it to the data, and hook up to a couple of key events:
const Demo = Vue.component('demo', {
  template: ` <kl-chart
    id="kl"
    :data="chartData"
    @kl-ready="onReady"
         @kl-selectionchange="onSelectionChange"
  / >`,
  components: {
     Chart
  },
  state: {
    selectedEmail: ""
  },
  data() {
    return {
      chartData: data
    }
  },
  methods: {
    onReady(chart) {
      this.chart = chart;
    },
    onSelectionChange() {
      // We’ll add selection logic here later
    }
  },

});
This code is written in ES6 using features widely supported by modern browsers: but the equivalent code will work in ES5, too. Or you can use a transpiler process like Babel to convert it into native ES5.
This renders and lays out our JSON data as a beautiful network of nodes and links.
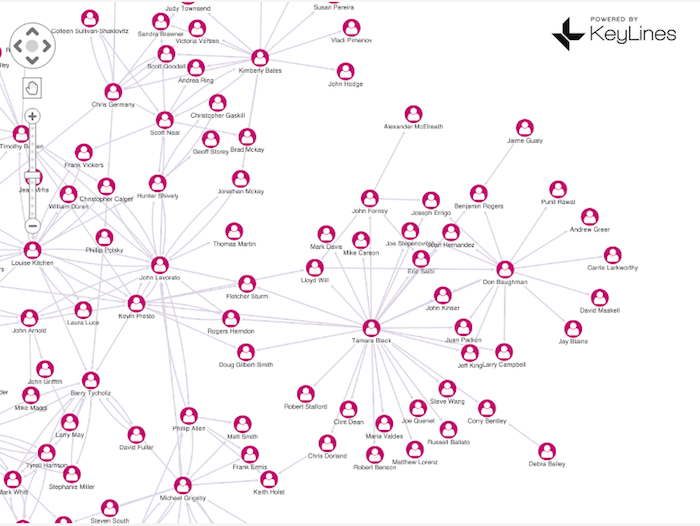
KeyLines provides a wide of range of visualization techniques, layouts and features for de-cluttering the chart. They’re all available to your Vue application through a Javascript API.
I won’t go into detail here on building you KeyLines UI, but you’ll find inspiration and full demo source code on the KeyLines SDK site.
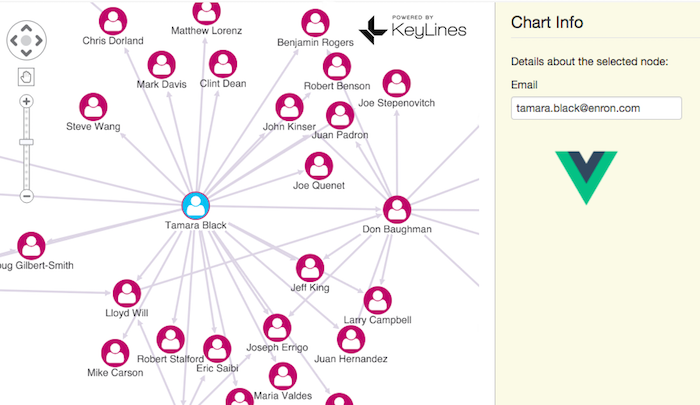
A common use-case when viewing the chart is to display data related to each node, often by showing a form next to the graph and updating it when the user selects a node. We can implement this very easily using Vue by binding data on the node directly to the UI.
First, we can add a special selection color to make the selected node stand out. We can do this by writing to an options object in our demo component’s data function:
const Demo = Vue.component('demo', {
  template: ...
  components: { ...},
  state: { … },
  data() {
    return {
      chartData: data,
    options: {
      selectedNode: {
        c: '#26BFF0'
      }
    }
  }
});
Secondly, we bind to KeyLines’ selection change event and add logic to update the form. All we need to do is look at what’s been selected and write its properties to the Vue application’s state object:
const Demo = Vue.component('demo', {
  /* … */
  onSelectionChange() {
     var selectedId = this.chart.selection()[0];

     if (!selectedId) {
       this.state.selectedEmail = '';
     } else {
       const selectedItem = this.chart.getItem(selectedId);
       if (selectedItem && selectedItem.d) {
         this.state.selectedEmail = selectedItem.d.email;
       }
     }
   }
});
Finally, we can bind that state to a form using a declarative Vue template:
<h2>Chart Info</h2>
<p>Details about the selected node:</p>
<label>Email </label>
<input
   type='text'
   :value="state.selectedEmail"
/>
This gives us an application that looks something like this:
We can also use built-in features of KeyLines to reduce the amount of data visible on-screen. For example, we can use the combo API to merge or group nodes with common properties. In the Enron data set, for example, we can combine people based on their team (or department).
The powerful KeyLines combo API makes this easy. We’ve added a method called combine() to our Vue component. This iterates over the graph, identifies all of the team leaders in the data (every employee has a “reports” property, listing the name of their team leader), and constructs a combo object listing all the nodes which should be part of that group. Here’s the code:
const Demo = Vue.component('demo', {
  /* … */
    combine() {
      var groups = {};
      var comboData = [];
      this.chart.each({ type: 'node' }, (item) => {
        var group = item.d.reports;
        if (group) {
          if (!groups[group]) {
            groups[group] = {
              ids: [],
              label: group + 's Team',
              glyph: { p: 'ne', c: '#26BFF0' }
            };
            comboData.push(groups[group]);
          }

          groups[group].ids.push(item.id);
        }
      });
      this.chart.combo().combine(comboData, { select: false }).then(this.layout);
    }
}
All we now have to do is hook this up to the UI. This template binds the combine methods to the click event of an HTML button:
<button
      type='button'
      class='btn btn-kl'
      @click="combine">
And we can radically clean up our chart at the click of a button.
Sign up for a trial to browse our API documentation and get a full sense of what KeyLines can do for your data.
This post shows how easy it is to integrate KeyLines with a Vue application. KeyLines also integrates with any backend – all you need to do is convert your source data into JSON and pipe it into KeyLines.
Request a trial of KeyLines today to view the source code for our interactive Vue demo.
The JavaScript ecosystem is always evolving and we’re keen to integrate KeyLines with the most popular frameworks available. Which KeyLines integrations would you like to see next? Contact us to let us know!
Visualize your data! Request full access to our KeyLines SDK, demos and live-coding playground.
Registered in England and Wales with Company Number 07625370 | VAT Number 113 1740 61
6-8 Hills Road, Cambridge, CB2 1JP. All material © Cambridge Intelligence .
Privacy Policy | Security Framework


