Cambridge Intelligence, creators of connected data visualization tools that make the world safer, today announced the release of KeyLines 5.0.
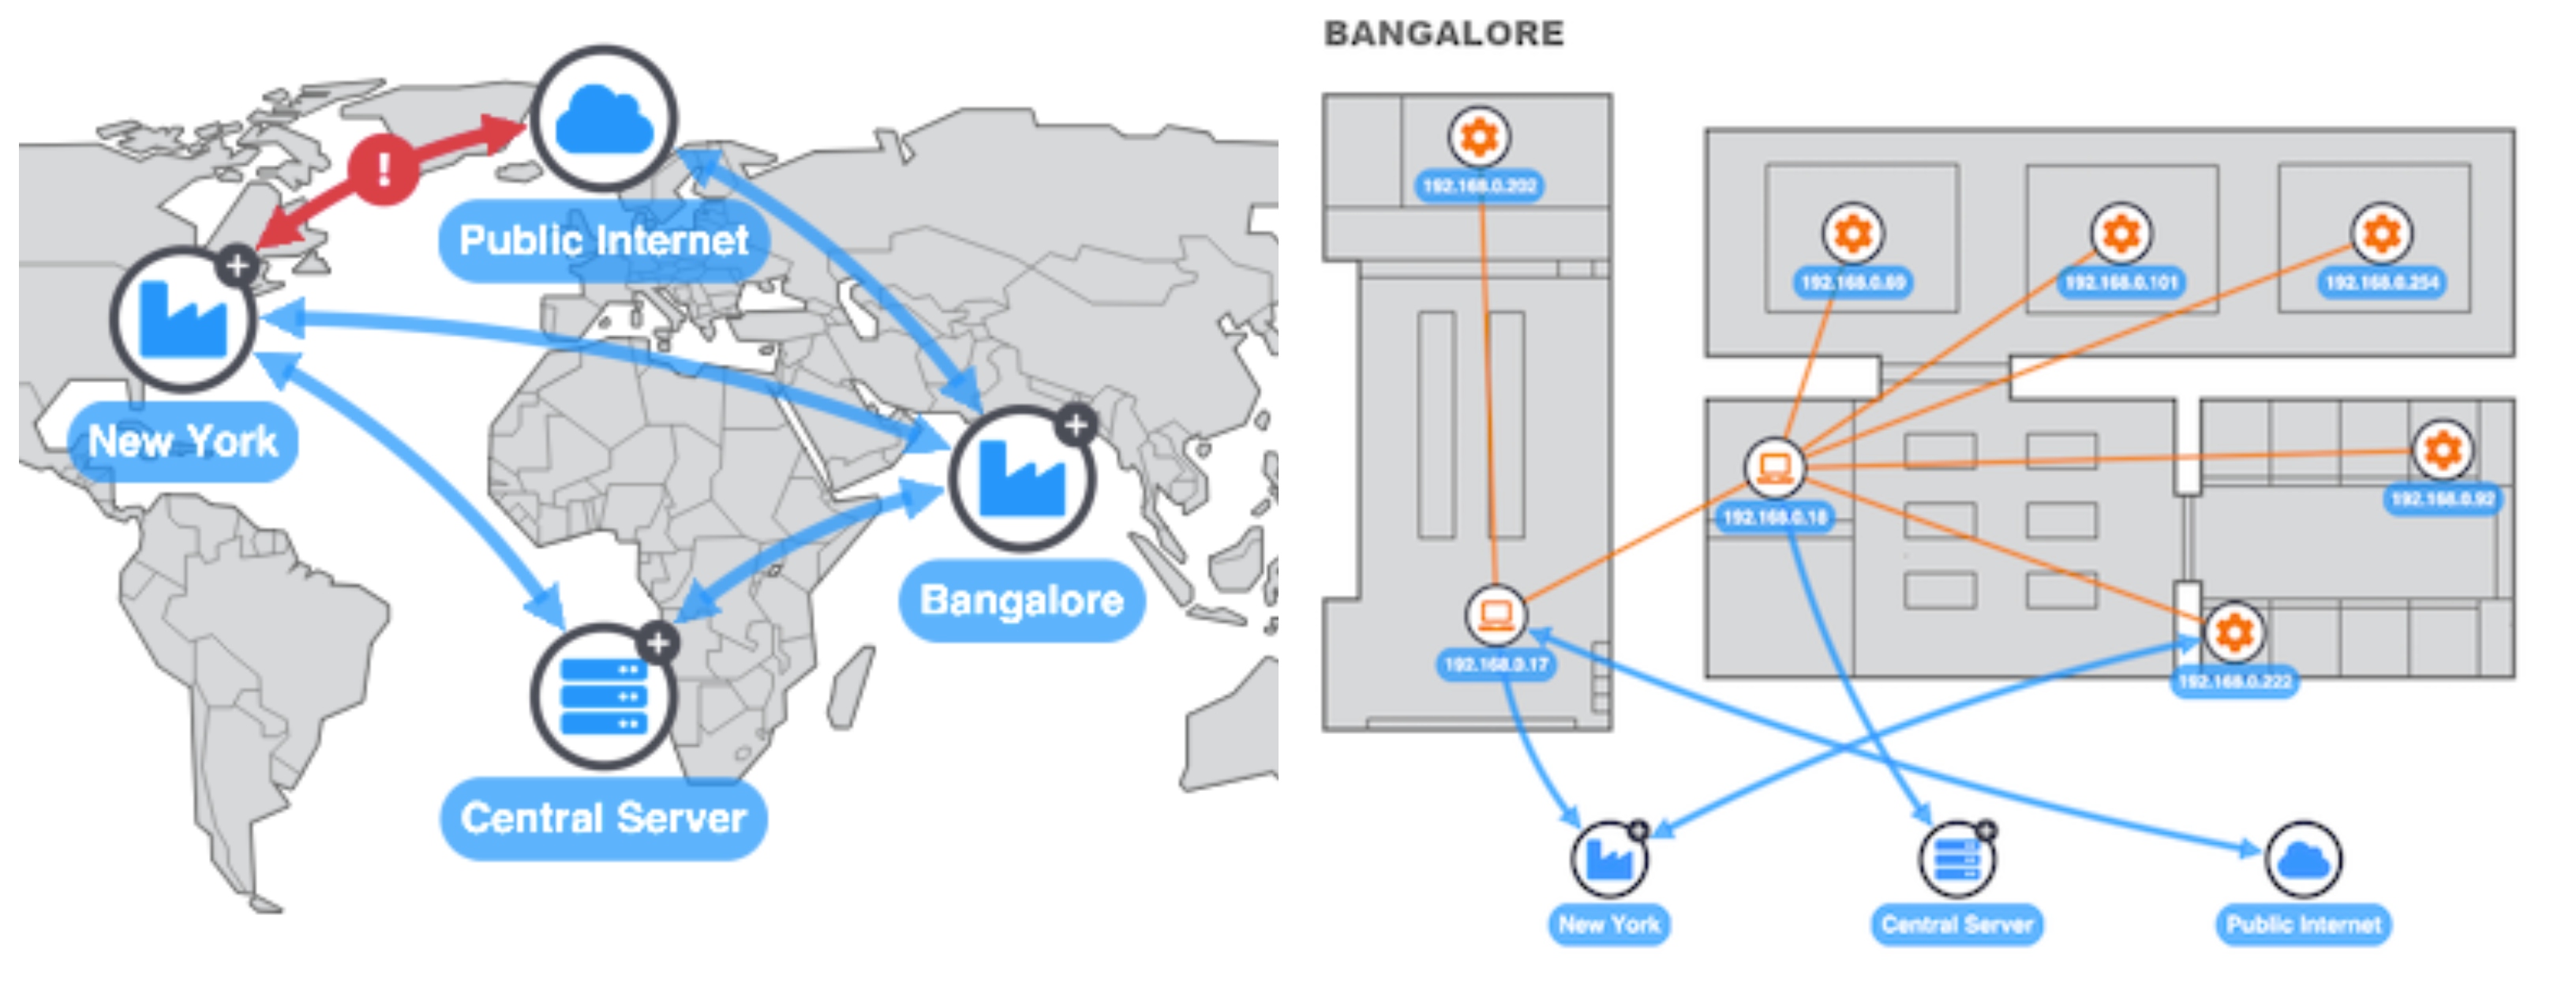
The latest version of the award-winning KeyLines toolkit includes a complete overhaul of its geospatial features. KeyLines 5.0 delivers a smoother, faster mapping experience that makes it easier than ever to visualize connections in geospatial data.
Location information holds a potentially rich source of data insight. From discovering fraud hotspots to understanding the location of cyber threats or IT network activity, KeyLines Geospatial helps you to better understand map-based connections.
The geospatial engine in KeyLines 5.0 supports a vast range of third-party map tile providers and plugins, giving you complete control over visualizing and interacting with geospatial data. Whether you’re using plugins for geofencing and map layers, or integrating with leading geospatial service providers like Esri, KeyLines delivers the right visualization solution.

Another major feature of KeyLines 5.0 is support for scalable background images in charts. Visualizing nodes and links on everything from floor plans to building footprints, transport hubs to IT network diagrams, gives insightful context to graph data. With the ability to smoothly transition between real maps and offline or image maps, this opens up a whole new world of connected data analysis.

The team of experts behind KeyLines 5.0 has also made wide-ranging improvements to the underlying engine that powers visualizations. It means much faster and more responsive loading times for charts featuring multiple images, plus a better experience for customers installing KeyLines for the first time.
Cambridge Intelligence founder and CEO, Joe Parry, said:
The geospatial features in this major release showcase our commitment to solving the real-world challenges facing our customers. We’ve delivered new ways to visualize location-based data to help reveal further insight. This version also lifts restrictions on mapping sources, allowing customers to build the geospatial graph visualization tool that’s right for them.
KeyLines 5.0 is a key milestone for Cambridge Intelligence. We’ll keep building on its success with future groundbreaking developments.
About Cambridge Intelligence
Founded in 2011, Cambridge Intelligence develops proprietary visualization technology used by intelligence agencies, police departments, companies and governments worldwide. Using the KeyLines data visualization toolkit, they can quickly build applications to visualize and analyze connections between people, events, locations, accounts, devices, and more. From law enforcement to cyber security and fraud detection, every day thousands of analysts rely on the technology to ‘join the dots’ in their data revealing threats and uncovering data insight.


