Tutorial: Visualizing OrientDB
Getting started with KeyLines and OrientDB visualization
- Page contents
- What is OrientDB?
- Why create an OrientDB visualization?
- Visualization Architecture
- Step 1: Connect your OrientDB database
- Step 2: Embed KeyLines in a web page
- Step 3: Query your OrientDB database
- Step 4: Parse the result
- Step 5: Layout your OrientDB visualization
- Step 6: Customize your chart
- Back to OrientDB
Start a KeyLines trial
To follow this tutorial, you’ll need a KeyLines evaluation account.
What is OrientDB?
OrientDB is a document-graph database, meaning it has full native graph capabilities coupled with features normally only found in document databases and the familiar SQL dialect. The OrientDB engine supports Graph, Document, Key/Value, and Object models, so you can use OrientDB as a replacement for a product in any of these categories.
However, the main reason why users choose OrientDB is its ability to act as a true Multi-Model DBMS by combining all the features of the four models into one. A variety of different licenses are available, ranging from a free open source option to an enterprise subscription.
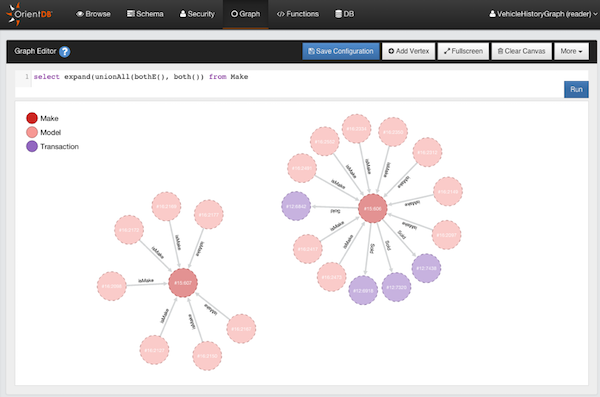
The OrientDB database includes its own query language (an extension of SQL), a developer workbench environment and a basic visualization tool known as the OrientDB Studio:
Some of the reasons to choose OrientDB include:
- Robustness – all transactions are fully ACID
- Multi Model DBMS – combining all the features of the four NoSQL models into one
Why create an OrientDB visualization?
- See patterns more clearly – the human brain can recognize and decode patterns visually much faster.
- Explore your data – visualization allows users to explore and traverse the database and gain a more meaningful understanding of their data.
- Answer questions – users can leverage visual analysis techniques (automatic layouts, filtering, SNA, the time bar, etc.) to enhance their understanding of data in their OrientDB database.
Interested in visualizing OrientDB data?
We recorded a webinar with the OrientDB team, exploring the benefits of integrating KeyLines with the multi-model database.
Visualization architecture
KeyLines is a database agnostic visualization solution, but the graph format of OrientDB makes it a particularly suitable back-end option.
The architecture of an OrientDB visualization application built with KeyLines looks like this:
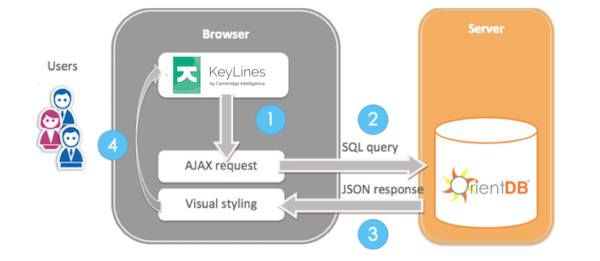
- The user accesses a KeyLines chart in their web browser. Each event performed, e.g. a click, right-click, hover, etc., raises a query to the OrientDB database.
- KeyLines raises this query as a jQuery AJAX request, which is natively translated into an OrientDB SQL query.
- OrientDB returns the required data as a JSON object.
- KeyLines renders the JSON data in the browser, using a WebGL or HTML5 Canvas component depending on the user’s browser.
Benefits of the KeyLines/OrientDB architecture
- Speed – The exact speed depends on the volume of elements being called to the chart, but visualizing an OrientDB database with KeyLines is fast, even with hundreds of nodes.
- Visual querying – KeyLines users can intuitively explore their data without learning any query languages.
- Browser-based – KeyLines is a browser-based technology. End users do not need to install any software or plugins before they get started. Also, as graphics are rendered client side, the required bandwidth is reduced and dedicated visualization servers are not required.
Creating your OrientDB visualization
These are the steps you need to follow to connect an OrientDB graph database to KeyLines and query it, then parse the results before creating a graph visualization ready for styling.
Connect your OrientDB database to KeyLines
- Download the OrientDB server files. These are all available from the OrientDB website.
- Install the OrientDB database as a server running on port 2480. This should be automatic, but you can test the configuration is correct by navigating to the following URL in Chrome or Firefox: http://localhost:2480/. This should give you a login page for the GracefulDeadConcerts database.
- You should be able to call a REST interface running at http:// localhost:2480/query/[database-name]/sql/. This is how KeyLines submits SQL queries, and how it receives the results as a JSON file.
- Click on the “Import a public database” (the orange cloud icon on the top right), then fill the first two fields with “admin”, “admin” (the default administration credentials) and download the “VehicleHistoryGraph” database.
Embed KeyLines in a web page
Once you have access to the KeyLines SDK and have installed your instance of OrientDB, you can embed a KeyLines chart into your webpage. The below assumes you are using an HTML5 Canvas compatible browser, and only need our JavaScript files.
The HTML code below is 1) loading a webpage, and 2) creating a KeyLines chart object.
<!DOCTYPE html>
<html>
  <head>

    <!-- Other libraries we want to use, e.g. jQuery -->
    <script src=”jquery.js” type=”text/javascript”></script>
  </head>
  <body>
    <!-- This is the HTML element that will be used to render the KeyLines component -->
    <div id=”chartID” style=”width: 400px; height: 300px;” ></div>

    <!-- This is the actual code to load KeyLines in the page -->
    <script type='module'>
      import KeyLines from './node_modules/keylines/esm/index.js';

      // This will store a reference to our KeyLines chart object
      var myChart;

      // wait until the fonts are loaded to start
      $(window).load(function () {

        // Set the path for the assets
        KeyLines.setCanvasPaths(‘assets/’);

        //load the component: specify where (id) and the callback
        KeyLines.create(‘chartID’, chartReady);
      });

      function chartReady (err, chart) {
        // Store a reference to the KeyLines chart object
        myChart = chart;


       // start with a Make query: let’s start from the Porsche node
       handleRequests(‘Make’, ‘name=”Porsche”’, function (items){

         // Now load the data in KeyLines
         chart.load({type: ‘LinkChart’, items: items}, layout);

      });
    }

    function handleRequests(type, criteria, callback){
      // The first query retrieve the links from a given node
      var query = “select expand(unionAll(bothE(),both())) from “+type + “ where “+criteria;

      // Call the OrientDB HTTP endpoint and fetch all the edges
      callSQL(query, function (edges) {

        // Transform from the OrientDB format to the KeyLines one
        var links = makeKeyLinesItems(edges);

        // Edges have only the ids of the vertices
        var ids = [];
        $.each(edges.result, function (i, edge){
          if(edge.in && edge.out){
            ids.push(edge.in, edge.out);
          }
        });
      // produce a new query to retrieve vertices info
      query = “select from V where @rid in [“+(ids.join(‘,’))+”]”;

      // Now ask for the vertices information
      callSQL(query, function (vertices){

        // now we can style the vertices too with KeyLines
        var items = links.concat(makeKeyLinesItems(vertices));

        // everything done now, return the control to the callback!
        callback(items);
      });
    });
  }
     … more here (see below) …
    </script>
  </body>
</html>
Query your OrientDB database
Now we have a KeyLines chart, we need to raise AJAX SQL queries to retrieve data from our OrientDB database. For our own convenience we can create a function to send AJAX requests to the HTTP endpoint:
function callSQL(query, callback) {
  // Put here the credentials for your OrientDB instance
  // We have nothing to write so reading-only permissions are enough
  var credentials = ‘reader:reader’;
  // This is the default URL for a local instance
  var baseURL = “localhost:2480/query/VehicleHistoryGraph/sql/’;
  $.ajax({
    type: ‘GET’,
    // Make all the bits together here for the full URL
    url: ‘http://’+credentials+’@’+baseURL+encodeURIComponent(query),
    // Remember to set the type to JSONP to avoid CORS issues
    dataType: ‘jsonp’,
    contentType: ‘application/json’
  })
  .done(callback);
There are two things taking place in this query.
Firstly, ‘callSQL’ accepts a query parameter, which is the full SQL query we want to run.
The “encodeURIComponent” is used to prevent encoding issues on the GET method used. Secondly, a callback function is called with a JSON response from our OrientDB HTTP endpoint.
Parse the result into KeyLines’ JSON format
Next we need to run a “makeKeyLinesItems” function to parse from OrientDB’s JSON format to KeyLines’ own format:
function makeKeyLinesItems(json){
  var items = [];

  $.each(json.result, function (i, item){
    // check if it is a link
    if(item.in && item.out){
      items.push(makeLink(item));
    } else {
      items.push(makeNode(item));
    }
  });

  return items;
}

function makeNode(item){
  var baseType = item[‘@class’].toLowerCase();

  var node = {
    id: item[‘@rid’],
    type: ‘node’,
    // get the label based on the type and content
    t: getNodeLabel(item, baseType),
    // get the icon based on the labels (needs some image assets)
    u: getNodeIcon(item, baseType),
    e: baseType === ‘make’ ? 2 : 1.2,
    // save the OrientDB item in case we need more info later
    d: item
  };
  // add the baseType as well
  node.d.type = baseType;

  return node;
}

function getNodeLabel(node, type){
  switch(type){
    case ‘transaction’:
      return node.price + ‘ $’;
    case ‘person’:
      return node.fullName;
    case ‘automobile’:
      return node.color + (node.convertible ? ‘\nConvertible’ : ‘’);
    default:
      return node.name;
  }
}

function getNodeIcon(item, type) {
  switch(type){
    case ‘transaction’:
      return ‘icon/new/bank.png’;
    case ‘person’:
      return item.gender === ‘Female’ ? ‘icon/new/woman.png’ : ‘icon/new/man.png’;
    case ‘automobile’:
      return ‘icon/new/vehicle.png’;
    case ‘model’:
      return ‘icon/new/id-card.png’;
    default:
      return ‘im/logos/’+item.name.toLowerCase()+’-logo.png’;
  }
}

function makeLink(item) {
  var baseType = item[‘@class’].toLowerCase();
  var isTransaction = /(sold|bought|purchased)/.test(baseType);

  var link = {
    id: item[‘@rid’],
    type: ‘link’,
    id1: item.in,
    id2: item.out,
    fc: ‘rgba(52,52,52,0.9)’,
    // draw an arrow pointing to the edge direction
    a2: true,
    c: isTransaction ? ‘rgb(127,205,187)’ : ‘rgb(0,153,255)’,
    w: 2,
    // save the item for future use
    d: item
  };
  return link;
}
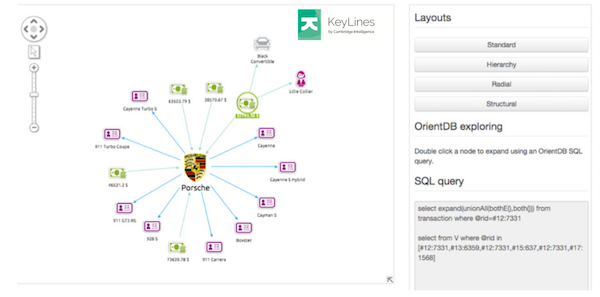
Layout your OrientDB visualization
Now that the data has been parsed and loaded in KeyLines, we just need a layout. You can choose from the growing list of automatic layouts listed in the API.
In the current example we’re going to use the standard layout with a nice force-directed “spring” effect from the center of the canvas:
Customize your chart
The final part of the process is to customize your chart’s appearance, workflow and functionality.
KeyLines offers a huge range of different ways to customize your final application – far too many to outline here. Instead, we recommend taking a detailed look through the KeyLines SDK documentation, especially the API reference and sample demos.
Try it for yourself
For more information about visualizing your OrientDB database with KeyLines, get in touch or request a trial here.
Interested in visualizing other graph data?
Our SDKs work with any browser, device or server, so you can choose the best tech stack for your project.