FREE: Managing fraud with visual link analysis
The ultimate guide to the role of link analysis and timeline visualization in fraud detection, investigation and prevention.
In this blog post we look at mobile money fraud detection techniques using KronoGraph’s powerful combination of time series charts and event timelines.
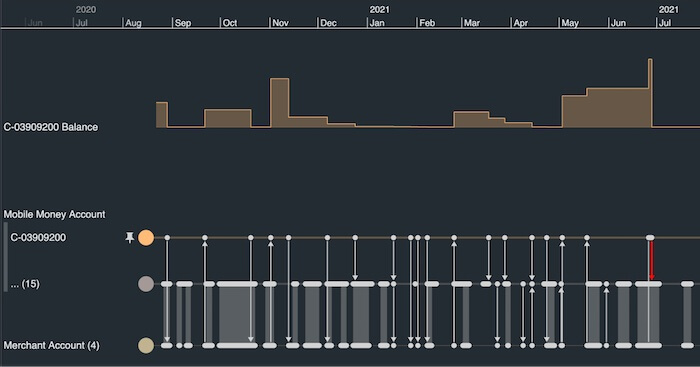
Mobile money is not the same as having a banking app on your cellphone or using phone-based payment services like Google or Apple Pay. They’re just alternative channels to access your traditional bank account.
Mobile money is a digital payment platform in its own right.
The mobile money account acts as an electronic wallet associated with the SIM card on a user’s cellphone. The user can send and receive funds or pay for services from their cellphone without the need for a traditional bank account. They can also use registered agents to deposit cash (cash-in) or transfer funds to other accounts and receive cash in exchange (cash-out).
The popularity of mobile money is growing year on year. The Global System for Mobile Communications Association (GSMA) reported that in 2020, there were more than 1.2 billion registered mobile money accounts – an increase of 13% since 2019.
With over $2 billion of funds transferred every day, it’s easy to see why financial service companies such as Stripe are investing in mobile money markets. They recognize the potential growth in regions such as sub-Saharan Africa where access to formal banking systems may be limited. Offering fast transactions, convenient access and secure payments, mobile money gives users instant control of their finances.
As this industry grows, it faces greater risks relating to mobile money fraud. In 2020, nearly $4 billion was lost to fraudulent mobile money activity and scams, a figure that’s expected to grow over time as fraudsters adopt increasingly sophisticated methods.
The most common types of mobile money fraud involve gaining control over a user’s cellphone by phishing via voice calls (vishing) or SMS messages (smishing). Once scammers have access to the device, they may carry out SIM-swap fraud by instructing the phone service provider to transfer the number to one of their own SIM cards.
These fraudulent practices typically involve a vast and highly-organized network of perpetrators. There has to be a robust anti-fraud response to secure the many users that rely on mobile money as their only means of financial control.
Many organizations already rely on our data visualization applications to identify, investigate and predict any type of fraud. Let’s focus on how timeline visualization helps to uncover and investigate mobile money fraud.
We’ll use a fictional yet realistic dataset of transactions from mobile money accounts. Our data model features accounts as entities linked to each other by transaction events:
Our dataset also includes a number of disputed transactions where account holders claim they didn’t authorize payment. These will be the focus for our mobile money fraud investigation.
Visualizing a timeline of mobile money transactions with KronoGraph answers the key questions an anti-fraud analyst needs to know:
Loading the data into the timeline immediately gives us a comprehensive and ordered view of the time frame during which the transactions occurred. We’ve chosen dark mode, but you can select whichever background color matches the style of your fraud investigation app.
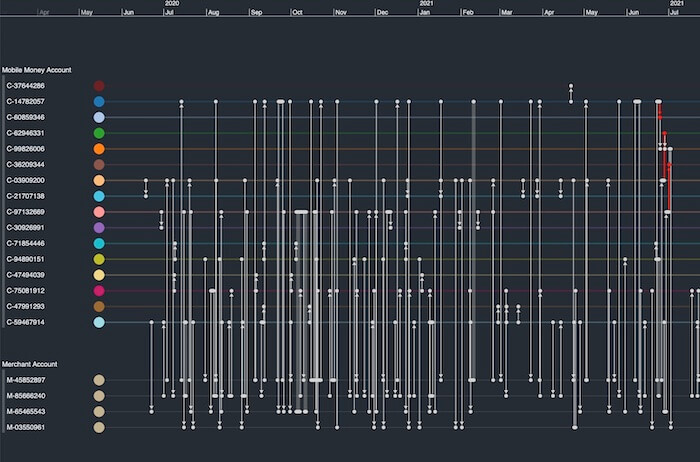
To make it easier to distinguish between Mobile Money Accounts and Merchant Accounts, we’ve organized them into separate groups. We’ve also styled our disputed transactions red so they stand out from the undisputed ones.
Timelines are fully interactive. Users can zoom in and out smoothly to explore data over years, months, weeks right down to minutes and seconds, leaving KronoGraph to manage the best way to display data at every scale.
We can see right away that three disputed transactions took place between June 24th and July 1st 2021.
To help us focus on the suspected mobile money fraud incidents, we’ve ‘pinned’ the account (C-14782057) involved in the first disputed transaction. We’ve configured KronoGraph so that pinning an account automatically displays another useful visualization:
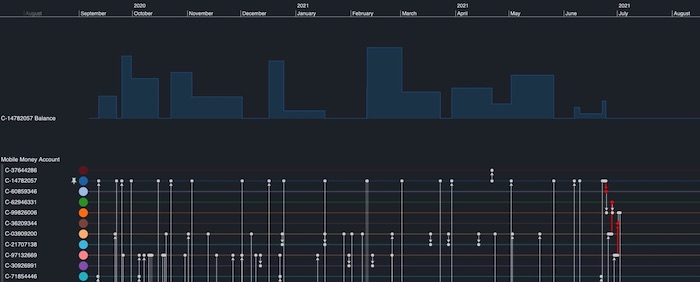
KronoGraph has overlaid a time series chart above the timeline. It reveals the fluctuating balance of the pinned account to help us identify what a ‘typical’ pattern of activity looks like. The account was very active before the disputed transaction occurred, with funds deposited on a regular basis.
However, after the disputed transfer on June 24th which empties their account, there is no more activity. This matches a common pattern of those that fall victim to a SIM swap scam: the cellphone has been accessed illegally, the account holder has been locked out and the remaining balance transferred out by the scammer.
The disputed transfer shows the victim’s balance was transferred to another mobile money account, so let’s follow the path of the funds to see if we can piece together what happened.
When we add a time series chart that shows the account balance activity of the receiving account (C-60859346), we immediately spot something unusual.
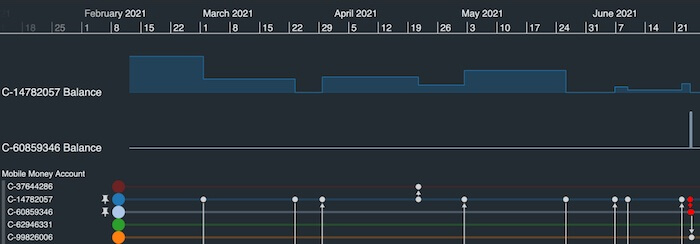
Look at the balance for receiving account C-60859346. There was no activity and zero funds in the account until the disputed transfer occurred on June 24th, shown by the single spike on the right-hand side of the time series chart. Was this a temporary account set up for the sole purpose of defrauding the other account?
If we zoom in to take a closer look at the transaction, we also learn that the funds were moved to another account within hours.
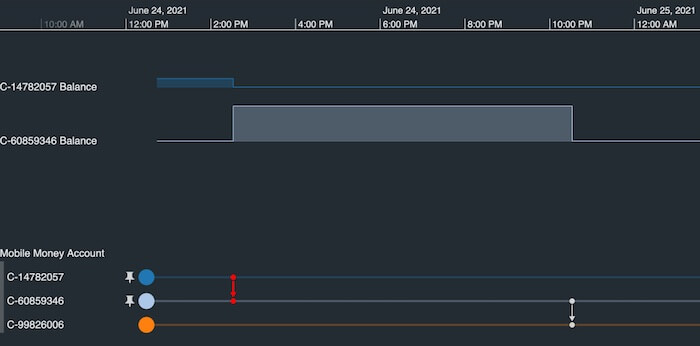
This is a common technique by fraudsters who are trying to obscure the trail of the funds. But is this a one-off or part of a much larger mobile money fraud operation? Let’s dig deeper to find out.
By following the path of the funds from the first disputed transfer on our timeline, we see that they were again swiftly transferred to another account (C-99826006). The time series chart for this account reveals two further balance increases around June 28th and July 1st.
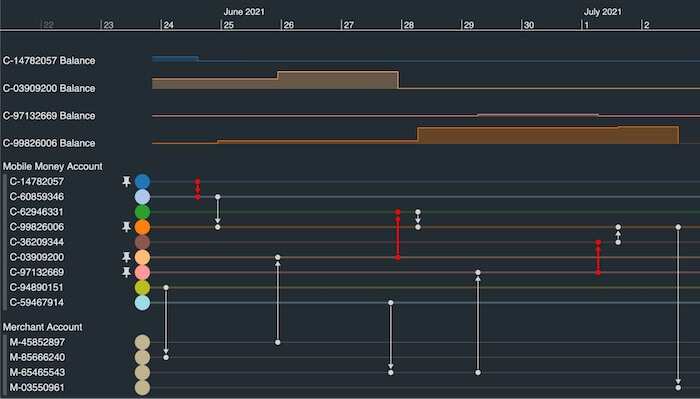
The timeline shows that those balance increases were down to two additional transfers, both of which are linked to disputed transactions.
Exactly the same pattern occurred: the entire balances in the targeted accounts were moved through different intermediate accounts during an 8-day period. Then on July 2nd, having pooled all three balances into one account, the fraudsters transferred the total amount to a Merchant Account (M-035550961) so it could be cashed out easily.
We’ve demonstrated how KronoGraph’s timeline visualization helps analysts investigate mobile money fraud. We’ve also shown how time series charts complement the timeline view, offering a powerful way to identify fraud patterns quickly.
We could take our investigation further by adding graph visualization, using our KeyLines or ReGraph toolkits. This gives users effective network analysis tools for gaining insight into fraudulent strategies alongside timeline analysis for understanding complex sequences of events.
Whatever type of fraud you’re trying to detect, make data visualization a central part of your strategy. Sign up for a free trial to get started.