We’re always trying to make life easier for our users. This time around, we’ve automated the way sequential layout places nodes, and created a new API to help with integration testing.
There are also new demos to showcase what we do best: visualizing complex connected data at scale without compromising on performance.
Sequential layout just got smarter
Our popular sequential layout now examines link directions across the network and calculates which nodes belong to what level. There’s no need to specify them manually – nodes are automatically placed in the hierarchical sequence you want.
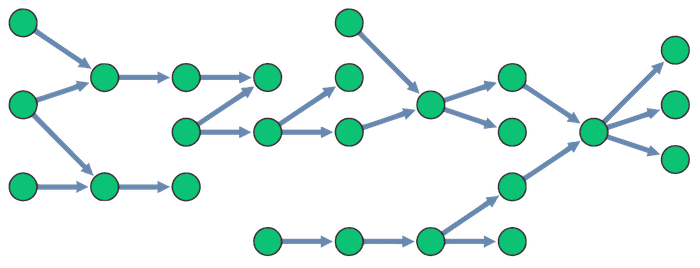
Prefer to customize sequential layout’s top nodes and levels yourself? No problem. Use the sequential layout options as before.
Test which items exist & where
When you’re running integration tests on a visualization app, knowing which items are present in a particular part of the chart is important. Our latest API – getItemInfoAt() – does exactly that. It’s the easiest way to find out what items exist at a specific x and y coordinate.
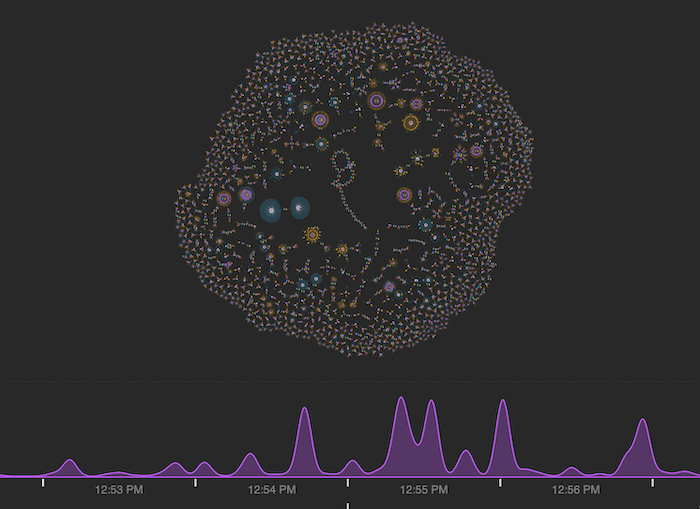
New: KeyLines Bitcoin transactions demo
Cryptocurrencies are widely regarded as the future of finance. Our new KeyLines Bitcoin demo shows how graph visualization helps you make sense of the fast-paced, complex world of blockchain technology.
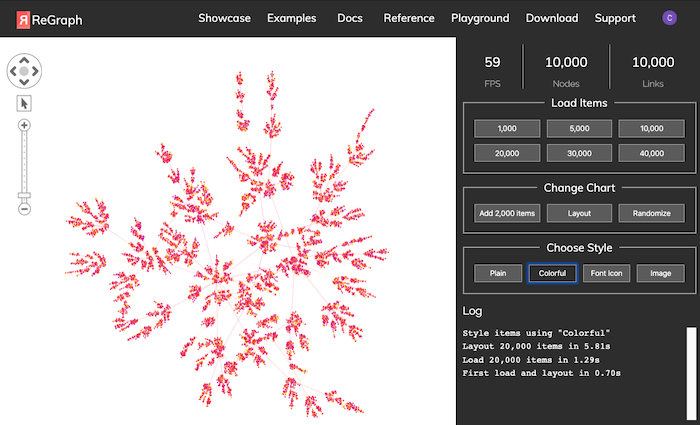
New: ReGraph performance demo
We’ve worked hard to deliver the most powerful network visualization toolkits so your users get the fast and insightful experience they deserve. WebGL provides impressive rendering speed and quality, and now you can measure performance more easily with ReGraph’s latest showcase demo.
You’ll also spot new and updated ReGraph documentation on everything from layouts and graph centrality measures to rendering and security.
Visualizing your data is easy
If you’re evaluating tools for building a graph visualization app, our KeyLines and ReGraph SDKs offer the unrivaled functionality your users need.
Getting started is easy. Just request a free trial or contact us to discuss how we can help make your visualization project happen.


