FREE: Start your KronoGraph trial today
Request full access to our KronoGraph SDK, demos and live-coding playground
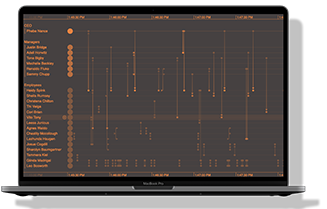
The latest version of KronoGraph, our timeline visualization toolkit, makes it easier to reveal detailed timings of events, even when you’re fully zoomed out of the timeline.
The new scale guide follows your cursor across the timeline, revealing the exact date/time of each event in its path. You don’t need to zoom in and out of individual events or rely on tooltips – the scale guide provides the time details you’re looking for.
This is particularly useful when you’re scanning huge datasets to pinpoint activity with nanosecond accuracy, for example, during a root cause investigation of an attempted network breach.
Designing accessible products means they can be used by as many people as possible, providing an inclusive experience for anyone with different needs.
The W3C’s Web Content Accessibility Guidelines 2.1 are most often referenced as an acceptable standard. We’ve updated the SDK’s accessibility documentation with a handy comparison against the W3C’s guidelines to help with your accessibility audits.
If you’ve got time-based connected data to analyze, you’ll want to give KronoGraph a try. Getting started is easy, with an introductory tour, showcase demonstrations and example code to show what you can achieve with your timelines. Request a free trial today.
Request full access to our KronoGraph SDK, demos and live-coding playground
Registered in England and Wales with Company Number 07625370 | VAT Number 113 1740 61
6-8 Hills Road, Cambridge, CB2 1JP. All material © Cambridge Intelligence .
Privacy Policy | Security Framework


