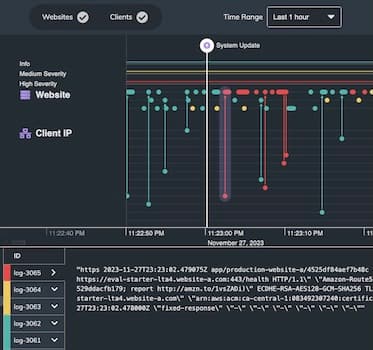
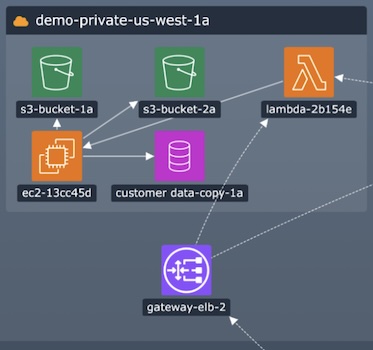
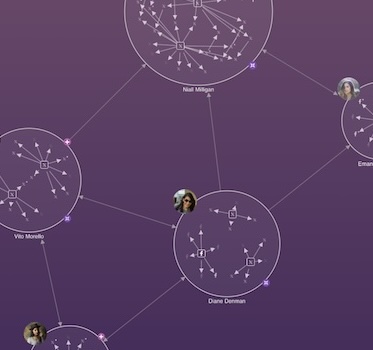
Cyber security analysts face data overload. They work with information on a massive scale, generated at millisecond levels of resolution detailing increasingly complex attacks.
To make sense of this data, analysts need an intuitive and engaging way to explore cyber threat intelligence: that’s where graph visualization plays a role. Suitable for a technical and non-technical audience.


