trust-hub’s mission is to “power the safe and compliant use of personal data”. The company helps both the public and private sector to optimize their personal data “ecosystems”, comply with the ever-changing global regulatory landscape and strengthen their privacy credentials.
In this blog post we take a look at trust-hub’s Privacy Lens application. We’ll see how it uses KeyLines-powered graph visualization to help organizations map, understand, optimize and control the flow of personal data.
The Problem
The introduction of the European General Data Protection Regulation (GDPR) on 25 May will make the challenge of complying with data protection regulation even more complex. Will Parton, Chief Technical Architect at trust-hub, explains that GDPR means privacy data can no longer be an afterthought:
“Businesses need to reassess their reasons for holding and processing personal data. They need to be able to justify and have a valid legal basis for its use and must ensure suitable operational and technical measures are in place to protect it.
GDPR transforms the landscape of personal data processing. The media has focused on the regulation’s potential fines, but it’s the powers of the Regulator to halt an organization’s processing of personal data or compel the disclosure of data breaches (and the likely reputational damage that results) that will have a much greater business impact.”
trust-hub realized that managing privacy data compliance is a graph problem. To ensure compliance, organizations need to understand a complex network of data connections. They turned to graph technology – and KeyLines – for help.
Will continues:
“Our modular platform, integrated with KeyLines, enables businesses to understand the complexity and risks of their personal data ecosystem, dynamically assess whether it is compliant (whether this is with GDPR, other national privacy regulations or internal policies) and make informed business decisions about its use.”
The Requirements
Building a graph visualization app from scratch is difficult and very time-consuming. trust-hub came to us with specific requirements, including:
- Compatibility: easy integration with the Neo4j graph database and the rest of their web stack
- Functionality: powerful visual analysis methods to enhance the processing performed on the back-end
- Clarifying data: the ability to ‘detangle’ dense networks of privacy data
- Visual customization: retain the look and feel of the rest of the application
KeyLines ticked all the boxes. Also, by partnering with our team of graph visualization experts, trust-hub could focus on other aspects of their application, e.g. machine learning, logic, security, risk management, data storage and reporting.
The Data
The first step to effective personal data compliance is to “Know Your Data”. For this, the trust-hub team use an abstract data model to help organizations represent the privacy data they hold. At the core of the model is “personal data and the 4 Ps”:
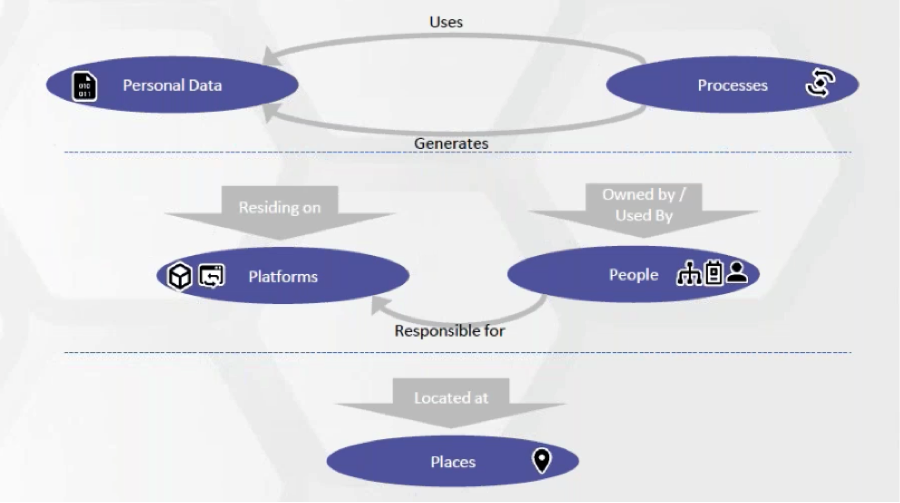
The model can be built using three means: manual forms, file-based import and web service APIs. The result is a complete picture of the organization from the perspective of personal data.
The Result
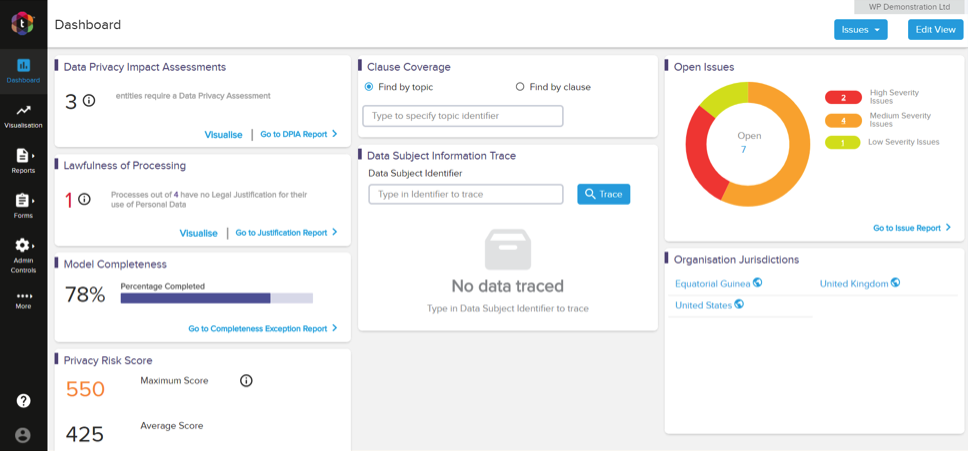
The Privacy Lens application itself has three tiers: dashboard, visualization and reporting. The top-level dashboard provides a customizable summary of an organization’s personal data:
This view is great for executive oversight, but what if the user needs to dig into the detail? That’s where the visualization layer, powered by KeyLines, comes into its own:
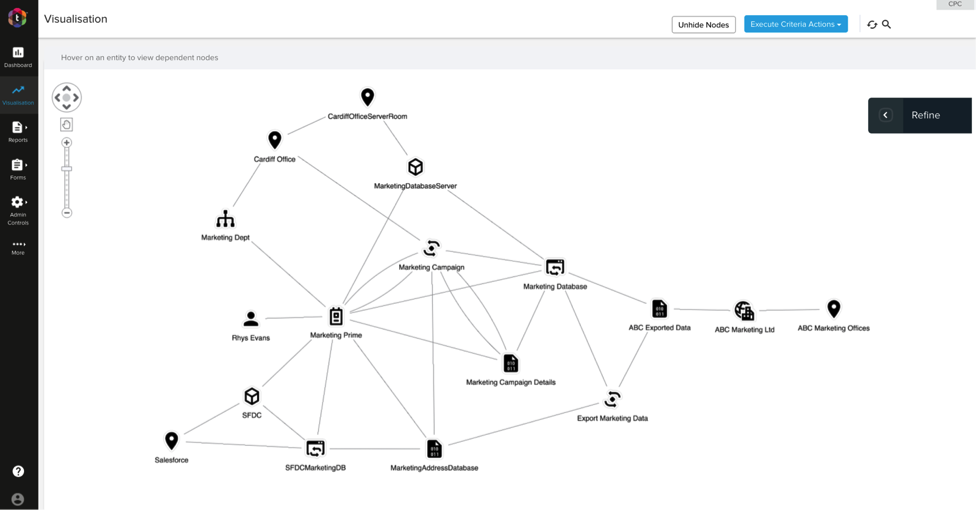
Using KeyLines, it’s possible to explore the data model and understand the connections between the data, processes, platforms, people and places. Importantly, this view can extend to the data supply chain, which historically has been the source of greatest risk.
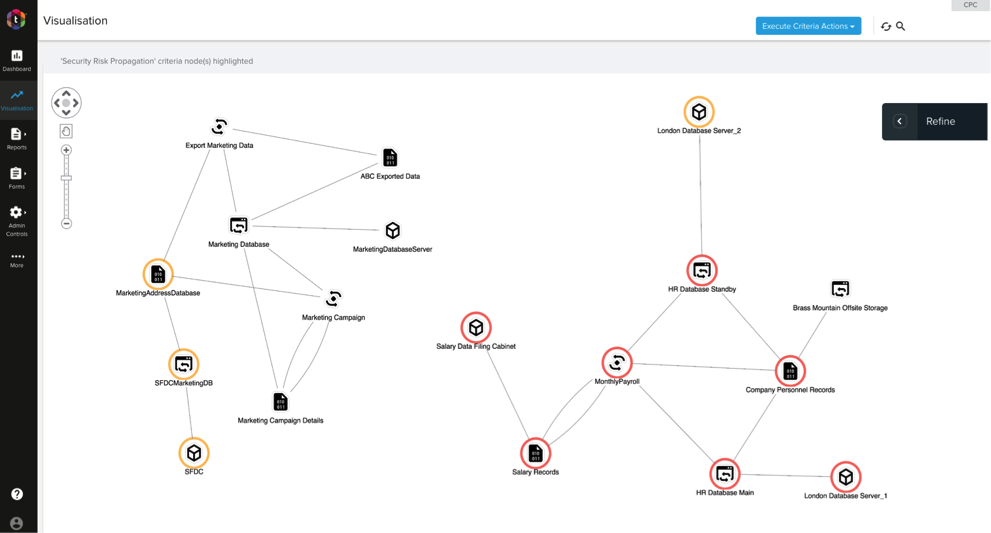
Understand risk propagation
Analyzing privacy data as an interconnected entity makes it easier to understand how risk is propagated around a network. If, for example, we know that a specific database is at high risk of being hacked, we can quickly and easily see which data and processes would be compromised as a result.
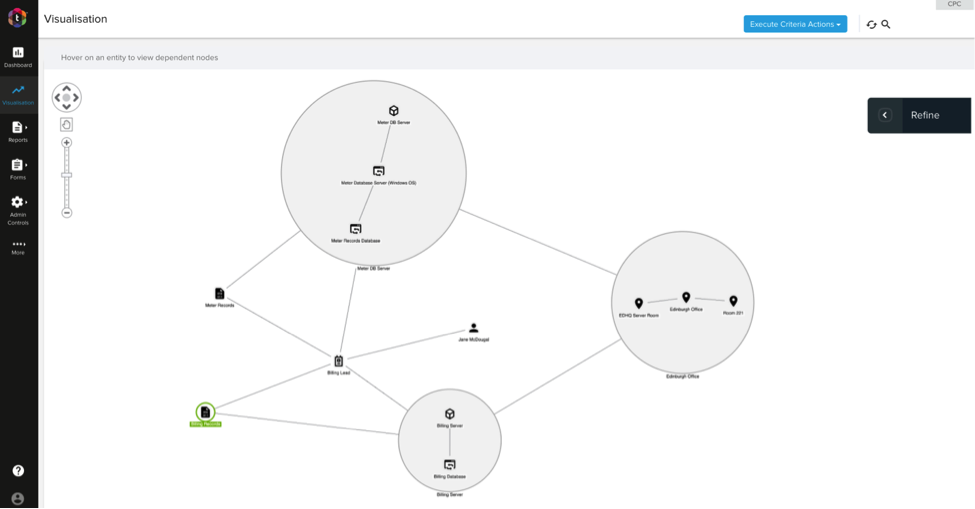
Reduce clutter
At first, the view can be a bit overwhelming. Using filters, we can get a clearer picture and drill down into the sub-networks of interest. Here, for example, we focus on everything directly related to a company’s Personnel Records:
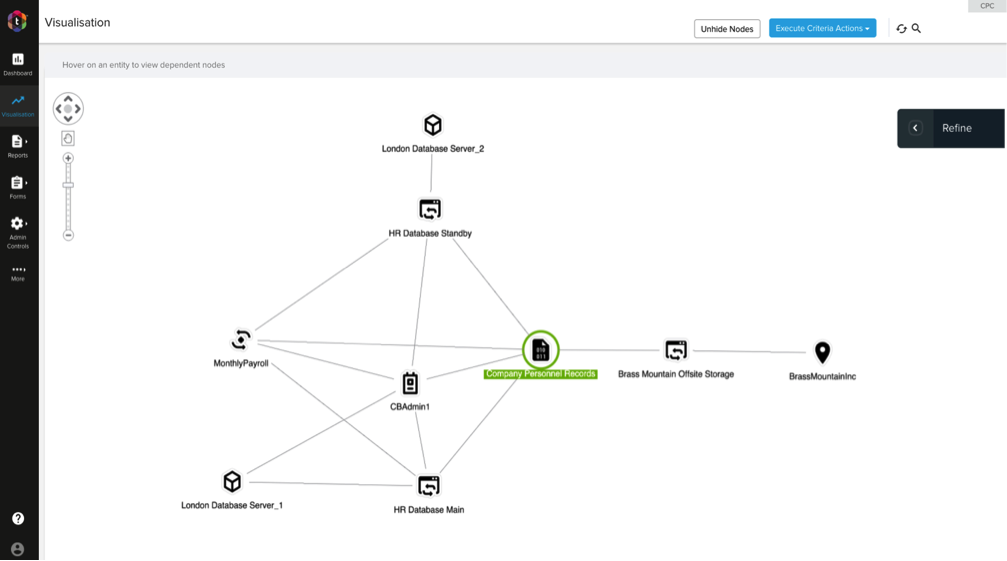
KeyLines’ new combos functionality allows certain entities be grouped together to hide unnecessary detail. The underlying structure can be revealed again with a simple double-click:
Identify compliance issues
Using the same filters, we can find out which parts of the organization are using data without justification. These are highlighted by halos – colored rings around the nodes – which can be further investigated using Privacy Lens’ reporting tier.
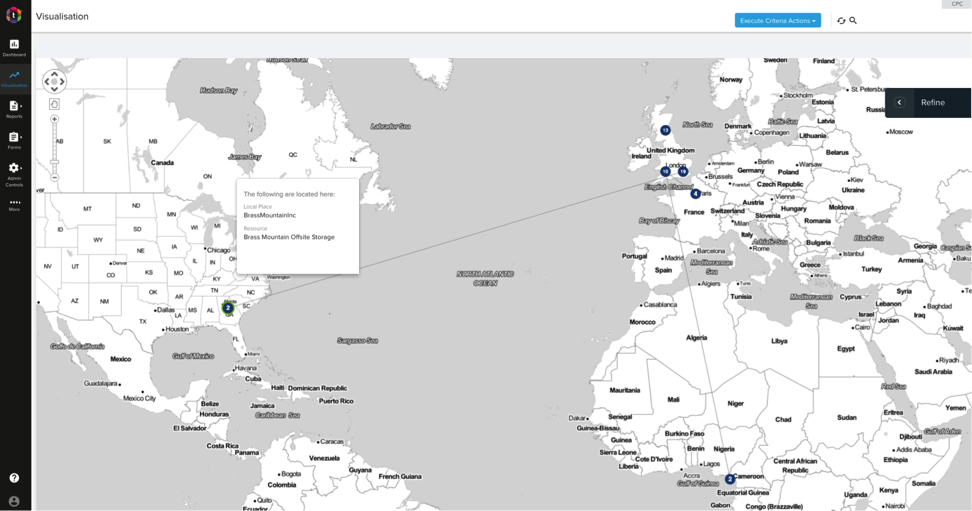
We can take this analysis one step further and trigger KeyLines’ geospatial component, which overlays the graph on to a map:
Using this graph-led approach, trust-hub’s users can turn a disparate collection of papers and data systems into a unified, comprehensive and dynamic view of an organization’s privacy data.
Request a trial to see how KeyLines can power your visualization.
Share: