We recently responded to Cambridge Intelligence customer requests and included the ability to add donuts to nodes. Donuts are circular node borders divided into segments that add up to 360 degrees. They work just like pie charts and allow you to show nodes values as numeric proportions.
To help make sure your visualizations are as clear and effective as possible, here’s a list of ‘Dos’ and ‘Don’ts’ when using donuts.
Do consider how much data you need to display
Donuts, like pie charts, work best when there are five segments or fewer. Crowding a single donut with more than 10 or 12 segments is likely to make your chart confusing. Identify the 3 or 4 largest segments, and then group the remaining values together into a generic category. This helps your users focus on what’s important.
If you want to display details or a breakdown of what’s in each category, add tooltips to the hover event on each segment.
Do choose colors carefully
Color plays a big part in how humans interpret data. Donuts come with a default set of colors, but you can choose your own. If you do, follow these simple tips:
- Keep colors consistent across nodes. The same category should be the same color throughout your chart.
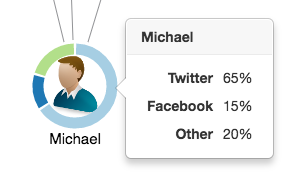
- Use brand colors if your data shows brands. Users are familiar with certain colors for brands (Facebook, Twitter, etc.) so use them to speed up the user’s understanding.
- Consider accessibility. Some users find it hard to differentiate between certain colors, so consider an alternative color scheme that these users can choose. It’s a good idea to choose distinct colors that are not too similar for donut charts. Using a color palette tool can help.
Learn how to select colors for data visualization.
Do think about adding a legend
Are users able to understand your color scheme? A legend next to the chart may help users grasp what you’re trying to communicate.
Do consider the order of your data in a donut
The first segment always starts at the 12 o’clock position. When viewing a single donut, it’s best to represent the largest amount of data in the first segment, then display the other segments from second largest to smallest clockwise around the node.
However, if you are using donuts to make comparisons between different nodes, it may be better to keep the color order consistent. Whichever option you choose, make it consistent across your graph.
Don’t bombard users with donuts
Showing a donut on every node in your chart might make it difficult to interpret. Instead, you could display an animated donut when you hover or select a node.

Don’t use donuts for absolute comparisons or non-relative data
Donuts are designed to display proportional data only. If you want to communicate other types of data, use a different feature, such as tooltips. Similarly, donuts aren’t good at comparing absolute quantities between nodes. Consider using glyphs for this instead.
We hope you found these tips useful. Now you’re ready to start using donuts to create some beautiful and informative visualizations.


