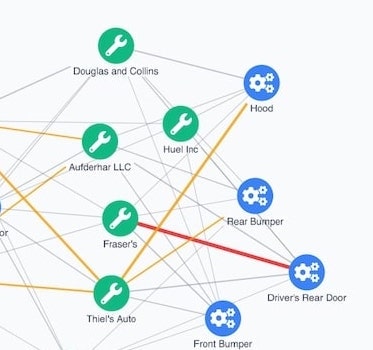
ArangoDB graph visualization
KeyLines & ArangoDB tutorial
Start a KeyLines trial
To follow this tutorial, and access the data files listed, you’ll need a KeyLines evaluation account.
This tutorial describes how to build an ArangoDB graph visualization by connecting KeyLines to ArangoDB – a native multi-model database that combines the strengths of graph, document and key-value stores.
What is a multi-model database?
Database technologies are optimized for specific types of data:
- Structured data —> relational database
- Unstructured data —> document store
- Highly connected data —> graph database, etc.
This approach, known as polyglot persistence, ensures good performance but presents challenges. Deploying to multiple database technologies in a single project is complex and has a greater maintenance overhead.
One way to avoid these problems is to use multi-model databases like ArangoDB. ArangoDB combines the advantages of a document, key-value and graph database with good performance and scalability.
ArangoDB can work with KeyLines to power a robust ArangoDB graph visualization application. Let’s see how.
[Disclaimer: This ArangoDB graph visualization tutorial uses database v3.7. We can’t guarantee this will work for future versions of the database system.]
Step 1: Set up ArangoDB
Download and install the latest ArangoDB version. There are full instructions in their excellent getting started guide.
Next, start the ArangoDB server. For this ArangoDB tutorial, we used a Mac and installed the database via Homebrew, so at the command line we enter:
/usr/local/sbin/arangod
You can run commands in the shell interface called ‘arangosh’. It’s best to create a user or change the root password before you continue. See the ArangoDB tutorial on managing users.
Go to http://localhost:8529 to see ArangoDB’s neat web interface. In this example, we’ll build a network of movies and actors to explore in a KeyLines application.
So, using the ArangoDB web interface, first create a new database called ‘movies’. Then switch to the dashboard for the newly created database and create:
- two document collections called ‘movie’ and ‘actor’
- an edge collection called ‘links’
Next, create a graph called ‘movies-graph’ with this setup:
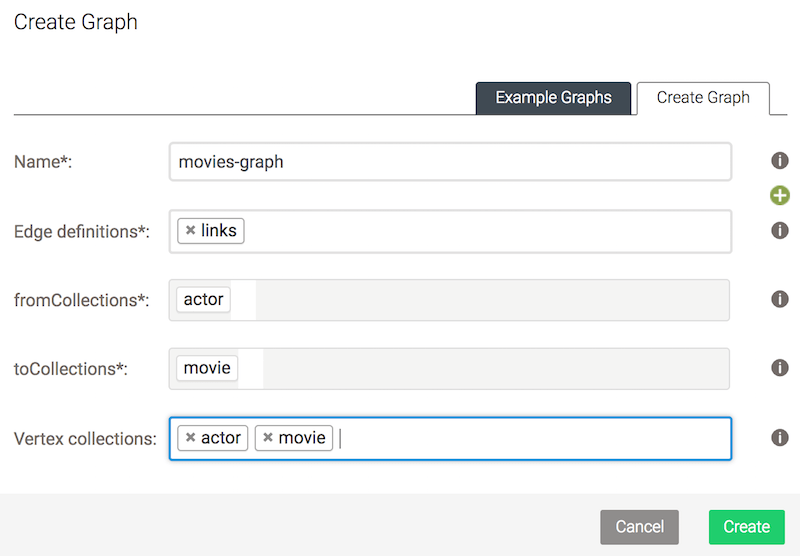
We’ve defined the graph with a single edge collection and 2 collections for vertices. (Note: vertex is a graph database term for node, and an edge is a link).
Now we’ve set up our collections and graph, we can import the data.
ArangoDB comes with a command-line tool ‘arangoimport’, which makes it easy to import data from different formats. The movies data is in three JSON files, which you can download from the ArangoDB demo on our SDK site. We’ll run these commands to import it into our database:
  arangoimport --server.database movies --file movies.json --collection movie
  arangoimport --server.database movies --file actors.json --collection actor
  arangoimport --server.database movies --file links.json --collection links
You may see some warning messages in the console about ‘unique constraint violated’. These may look scary but are completely safe to ignore. Due to the way we created the JSON files, this is just ArangoDB’s way of telling us that it will not create a vertex more than once, which isn’t a problem for us.
Don’t forget to add the options ––server.password [password] or ––server.username [username] if you have different credentials. See ArangoDB’s documentation on importing data.
Step 2: Query the database
To make querying ArangoDB easier, the team have created the Arango Query Language (AQL). For example, to find Keanu Reeves in the database, in the “Queries” section of the movies database dashboard, run:
FOR a IN actor FILTER a.name == 'Keanu Reeves' RETURN a
These results are a starting point that we can build on. To find movies that Keanu Reeves acted in, run:
LET start = (FOR a IN actor FILTER a.name == 'Keanu Reeves' RETURN a)[0]
FOR movies IN 1 OUTBOUND start GRAPH 'movies-graph' RETURN movies
A great feature of ArangoDB is that we can use JavaScript syntax to decide how query results should be returned. It means we can present our JSON result in a KeyLines-ready format, without any client-side processing.
For example, to request a specific actor and their direct connections, run:
LET start = (FOR a IN actor FILTER a.name == 'Keanu Reeves' RETURN a)[0]
  RETURN APPEND([{
  id: start._id,
  type: 'node',
  t: start._key,
  d: start
  }], FLATTEN(FOR v, e IN 1 ANY start GRAPH 'movies-graph'
    RETURN [{
      id: v._id,
      type: 'node',
      t: v._key,
      d: v
    },
    {
      id: e._id,
      type: 'link',
      t: e._key,
      id1: e._from,
      id2: e._to,
      d: e
    }]))
The ArangoDB website has some great AQL resources to help you return custom results.
Step 3: Write a Foxx microservice
Foxx is a JavaScript framework that runs inside the ArangoDB container. It lets you write standard V8 JavaScript, and create REST endpoints that can return ArangoDB queries. The syntax is similar to the Express framework for Node.js.
Here’s a simple example of a Foxx service:
'use strict';
const createRouter = require('@arangodb/foxx/router');
const router = createRouter();
router.get((req, res) => {
  res.write('Hello World!');
});
This sets up a router for any request that hits our endpoint and responds with ‘Hello World!’. If we load this Foxx service onto our database (more on how to do this later), then we can go to a URL similar to http://localhost:8529/_db/my_foxx_service/ to see a browser-based response.
Let’s build a more useful Foxx microservice. Create a new folder called ‘keylines-service’, for our Foxx microservice code.
Now create a manifest.json file that describes the service:
{
  "name": "keylines-service",
  "version": "1.0.0",
  "engines": {
    "arangodb": "^3.0.0"
  },
  "main": "main.js",
  "description": "Send queries to an ArangoDB graph and get the response in the KeyLines JSON format",
  "keywords": ["keylines"]
}
Next create the main.js file that contains our Foxx code:
'use strict';
const createRouter = require('@arangodb/foxx/router');
const router = createRouter();
const joi = require('joi');
const { db, aql, errors } = require('@arangodb');

router.get('/:name', function (req, res) {
  const { name } = req.pathParams;
  const query = aql`
    LET start = (FOR a IN actor FILTER a.name == ${name} RETURN a)[0]
    RETURN APPEND([{
      id: start._id,
      type: 'node',
      t: start._key,
      d: start
    }], FLATTEN(FOR v, e IN 1 ANY start GRAPH 'movies-graph'
      RETURN [{
        id: v._id,
        type: 'node',
        t: v._key,
        d: v
      },
      {
        id: e._id,
        type: 'link',
        t: e._key,
        id1: e._from,
        id2: e._to,
        d: e
      }]))
  `;
  res.send({type: 'LinkChart', items: db._query(query).toArray()[0]});
})
  .pathParam('name', joi.string().required(), 'The name of the actor to query.')
  .response(joi.object().required().keys({
    items: joi.array().items(joi.object().required().keys({
        id: joi.string().required(),
        type: joi.string().required()
      })),
    type: joi.string().required()
  }))
  .summary('Query arango and get results in KeyLines JSON format')
  .description('Get neighbours for a node with a given ID. The query result is returned in KeyLines JSON format.')

module.context.use(router);
That’s all the code we need for our Foxx microservice. To install this in ArangoDB, go to the parent directory of the service, then run this command to create a zip that contains the service:
zip -r keylines-service.zip keylines-service
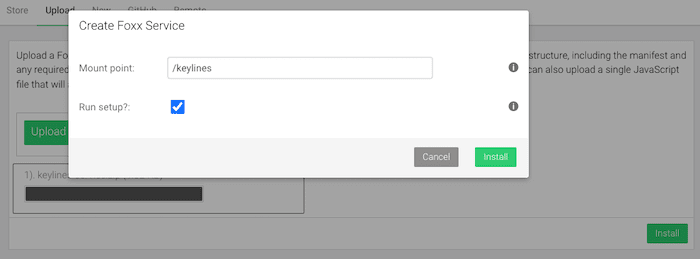
Go to the web interface and click ‘Services’, then ‘Add Service’ and select the ‘Upload’ tab. Upload the ‘keylines-service.zip’ file and choose an appropriate mount-point (the URL from which we can access the service – we call it ‘/keylines’ in this example) and upload the zip file.
You can also deploy Foxx services from a terminal. Check out Foxx CLI for that.
Finally, go to
http://localhost:8529/_db/movies/keylines/Keanu%20Reeves
to see the JSON result of our service.
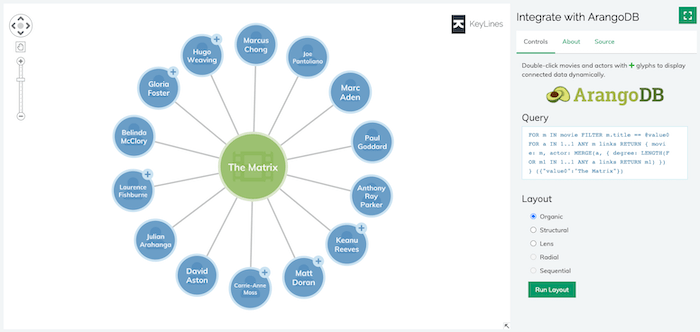
Step 4: Build your ArangoDB graph visualization
Now that ArangoDB returns data in KeyLines format, you can easily set up a KeyLines demo using the microservice as the backend. The fastest way to get started is to:
- Start your KeyLines trial
- Follow the step-by-step Quick Start guide available from the KeyLines SDK
- Change the code in your ‘app.js’ file to:
const chartDivId = 'kl';
let chart;
window.onload = () => {
  KeyLines.promisify();
  KeyLines.create({container: chartDivId}).then((loadedChart) => {
      chart = loadedChart;
      fetch("http://localhost:8529/_db/movies/keylines/Keanu%20Reeves").then(res => res.json())
          .then((data) => {
              chart.load(data);
              chart.layout();
          });
  });
};
The JavaScript file doesn’t need to process data. We could easily extend this demo to incorporate other features of KeyLines, or provide a search box and allow users to search for any actor (or movie with some minor adjustments to our microservice).
Step 5: Customize your ArangoDB graph visualization
Now you’ve completed the ArangoDB graph visualization tutorial, the final part of the process is to customize your chart’s appearance, workflow and functionality. For example, you could give your users a search box so they could look up actor/actress names (or movie with some minor adjustments to our microservice).
KeyLines offers many different ways to customize your final application. See the KeyLines SDK site, especially the API Reference and sample demos, to find the styles you need.
Build powerful apps with KeyLines and ArangoDB
If you’re ready for a deeper dive, check out this webinar. We take a quick look at some interactive graph visualization examples, and how KeyLines can be easily integrated with your ArangoDB database.