Relational database visualization
with KeyLines
You may think that relational databases aren’t suited to graph analysis and visualization.
Whilst it’s true that the tabular data model and schema restrictions can sometimes make relational databases an inefficient option for visualizing connected data, with the right data modeling it is possible. In fact, sometimes a tabular view may be the most efficient storage and query mechanism.
What is a relational database?
A relational database stores related data in two-dimensional tables of columns and rows. Each data entity is represented with its attributes in the columns, and data instances in the rows:
| Policy_number | Policy_Address | Vehicle_VIN | Vehicle_Model | Vehicle_Year |
| AB123123 | 123 Road Street | 19UYA1234L000213 | Coupe | 2012 |
| ZN 987987 | 42 Mill Crescent | 1005 | Estate | 2007 |
| JP 456456 | 12 Sample Street | 19UYA1234L000213 | Coupe | 2012 |
Using a non-relational datastore?
Creating a network with SQL Joins
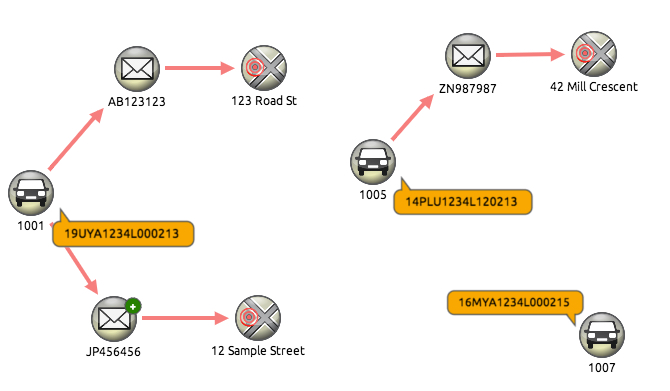
These tables, known as relations, can rapidly grow to millions, or billions of rows. It’s possible to get data from multiple tables. For example, suppose the data shown above was stored in two separate tables:
Policy
| ID | Number | Address | Vehicle_ID |
| 1 | AB123123 | 123 Road Street | 1001 |
| 2 | ZN987987 | 42 Mill Crescent | 1005 |
| 3 | JP456456 | 12 Sample Street | 1001 |
Vehicle
| ID | VIN | Model | Year |
| 1001 | 19UYA1234L000213 | Coupe | 2012 |
| 1005 | 14PLU1234L120213 | Estate | 2007 |
| 1007 | 16MYA1234L000215 | SUV | 2014 |
As long as there is a column that appears in both tables (in this case, the vehicle ID), we can cross-reference using the JOIN SQL operator. In the vehicle table, this column is known as the Primary Key. In the policy table, it’s the foreign key.
Using the JOIN operator, we can start to build up a complex connected data structure, resembling a network, or graph, that we can visualize in KeyLines. Joins, however, can be expensive in terms of performance.
Optimizing SQL joins for relational database visualization
Once we understand how a join works, it’s possible to fine-tune the logic to speed up system performance. For example:
SELECT *
FROM Policy JOIN Vehicle
ON Policy.Vehicle_ID = Vehicle.ID
The SQL statement above will search all the Vehicle IDs in the Policy table to find a match in the Vehicles table. If the table contains 1,000,000 rows, the user will have to wait for the system to finish scanning all of them.
Database administrators can overcome this by:
- Designing data schemas to reducing reliance on joins
- Using indexes to improve lookup speed
Taking these steps can help ensure database performance doesn’t become too much of a bottleneck.
Converting relational data structure to a network
How relational data is modeled as a graph depends entirely on the data being visualized and the questions you’re asking.
Taking the above vehicle / policy example, there would be four generic steps required:
- Understand the data – know which entity attributes and record formats are present in the data, and how they relate to one another.
- Combine required data relations – where possible, move the data into a single table to reduce the reliance on joins.
- Identify key relationships – understand which relationships users need to understand to answer the questions they are asking.
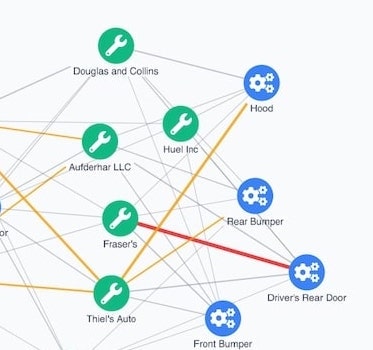
- Model data around key relationships – For example, an insurance fraud analyst may need to identify vehicles with more than one insurance policy, in which case the Vehicle Identification Numbers and Policy Numbers would be mapped to nodes, with the remaining data entities included as properties:
When mapping tabular data to a connected graph format, it’s important to consider how to manage IDs – important because KeyLines will automatically merge new data into an existing node if the ID already exists on the chart.
For example, in the case above we could set the vehicle make as the node ID field, so all Nissan vehicles appear as a single node. This could be useful for understanding patterns on a brand level.
Alternatively, the car number plate could be set as the node ID. This way, each unique number plate would appear as a unique node, which is potentially more useful to an analyst. However, it would still be necessary to carefully plan this structure and consider potential anomalies – stolen, shared or transferred number plates, for example.
This blog post explains the basics of modeling tabular data as a graph.